



Ground risk is one of the most underestimated challenges in property development. When we first wrote about this back in June, GeoScreen screened for nine geohazards, across England only. Since then the platform has grown: two further geohazards have been added — surface water flood risk and aggressive ground conditions — a separate Source Protection Zone check now runs on every report, and GeoScreen itself now covers England and Wales, not England alone.
This is the updated list — twelve ground risks GeoScreen screens on every site, in every report. Rather than illustrate these with generic diagrams, every figure below is pulled directly from a real GeoScreen report in our test archive, so you can see exactly what the underlying data looks like when your site returns a result.
1. Mining Legacy
Former coal mining, salt extraction, ironstone and other mineral workings can leave voids, subsidence features and unstable ground behind — sometimes well over a century after the last working closed. The Mining Remediation Authority (MRA) maintains Development High Risk Areas (DHRA) across the coalfields of England and Wales; a site within one typically requires a Coal Mining Risk Assessment before planning can be granted. GeoScreen queries the MRA’s own mine entry data directly and classifies each entry individually as a shaft or an adit, rather than reporting a single generic “mining present” flag.
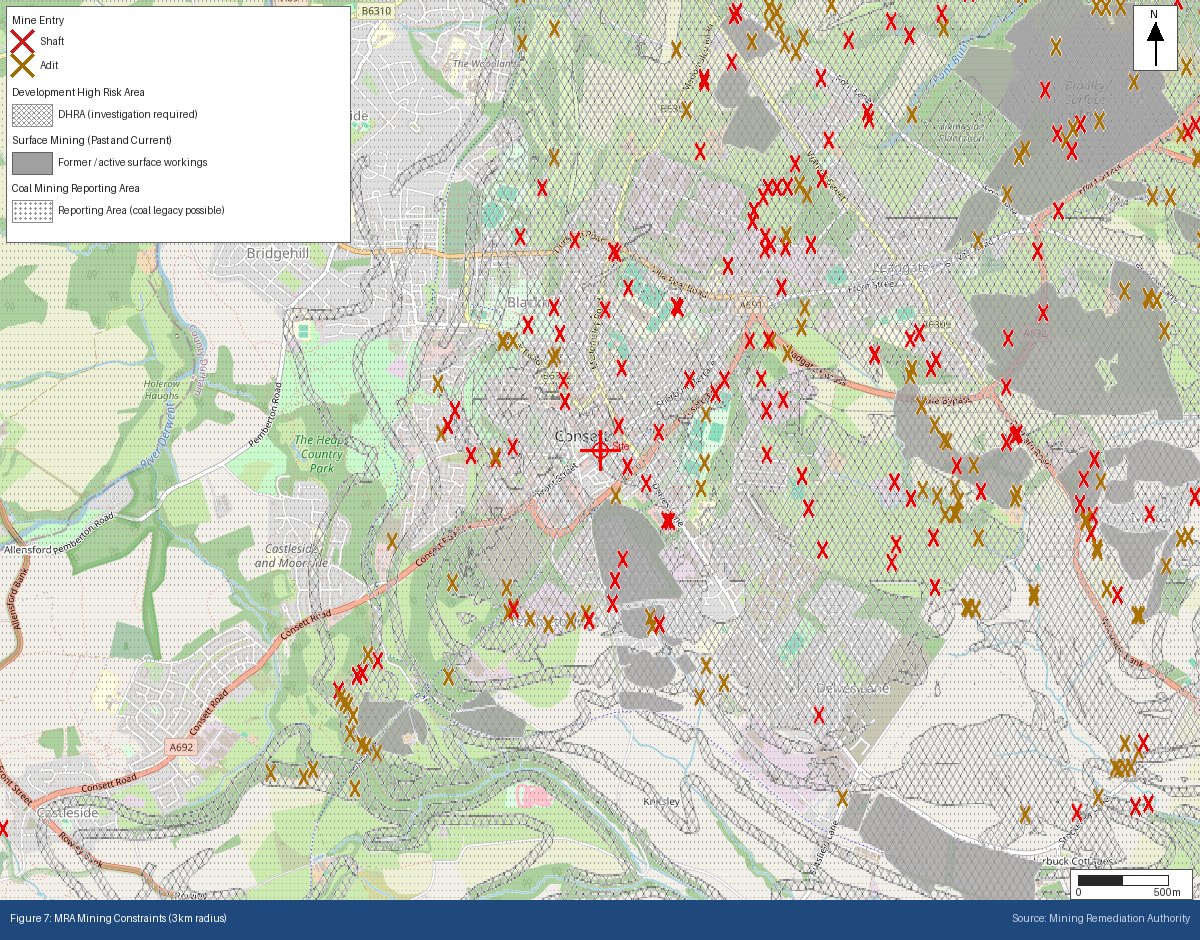
Consett, County Durham — a genuine Development High Risk Area. Every red cross is an individually classified mine shaft, every amber cross an adit, drawn directly from MRA data around the site.
2. Compressible Ground
Soft deposits such as peat, alluvium and made ground can compress slowly under the weight of a new structure, causing long-term settlement rather than sudden failure — the kind of problem that shows up as cracked slabs and sticking doors years after completion, not on day one. It’s most relevant on valley floors, riverside sites, and land that’s been reclaimed or built up over time. GeoScreen identifies compressible deposits from BGS 1:625,000 superficial geology mapping at the site, and also checks the bedrock beneath it: overconsolidated clay formations such as the Gault, Kimmeridge Clay, Oxford Clay, Lias Group and Mercia Mudstone can settle under load too, even where nothing soft is mapped at the surface. That’s a different mechanism from shrink-swell below, so the same clay can be rated for both — more on why here.
3. Shrink-Swell Clays
Clay soils expand when wet and contract when dry, and that seasonal movement can crack foundations and distort structures over time — one of the most common causes of subsidence claims in England and Wales. London Clay, Gault Clay, Kimmeridge and Oxford Clay, and the mudstone-rich Lias Group are the formations most associated with this risk. GeoScreen rates shrink-swell susceptibility from the bedrock formation mapped beneath the site.
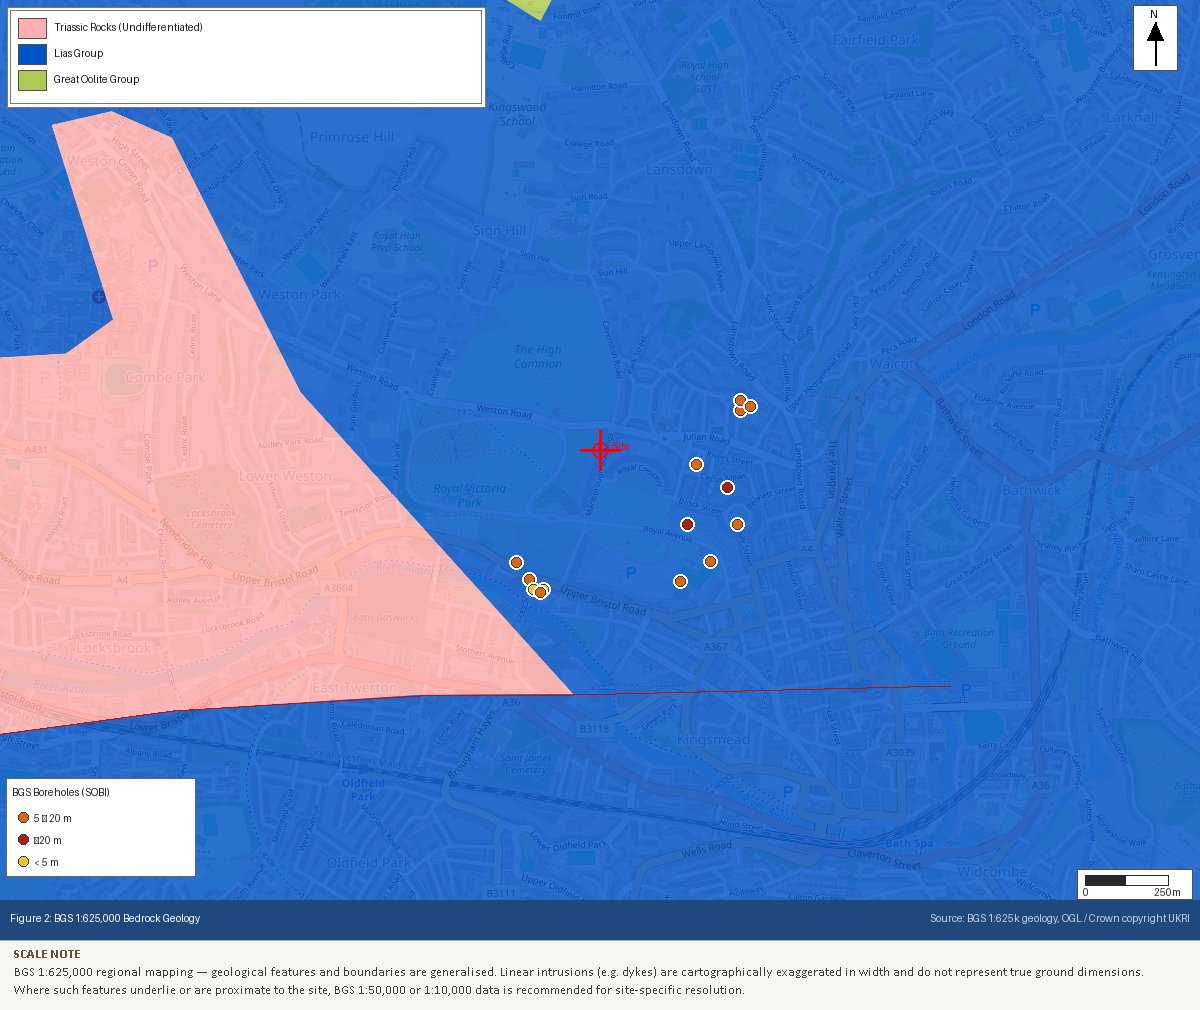
The same BGS 1:625,000 bedrock mapping feeds three of these ratings at once — Compressible Ground, Shrink-Swell Clays, and Dissolution Features below all read from this figure, alongside Aggressive Ground Conditions further down. This example, from Bath, shows the Lias Group boundary running directly through the site.
4. Slope Instability
Sites on or near slopes can be susceptible to landslides, shallow failures, or long-term creep — a risk that topographic maps alone don’t always make obvious. GeoScreen now generates a LiDAR-derived digital terrain model for every site at 1m resolution, rendered as a hillshade so genuine slope and terrace features are visible at a glance, not just inferred from contour lines.
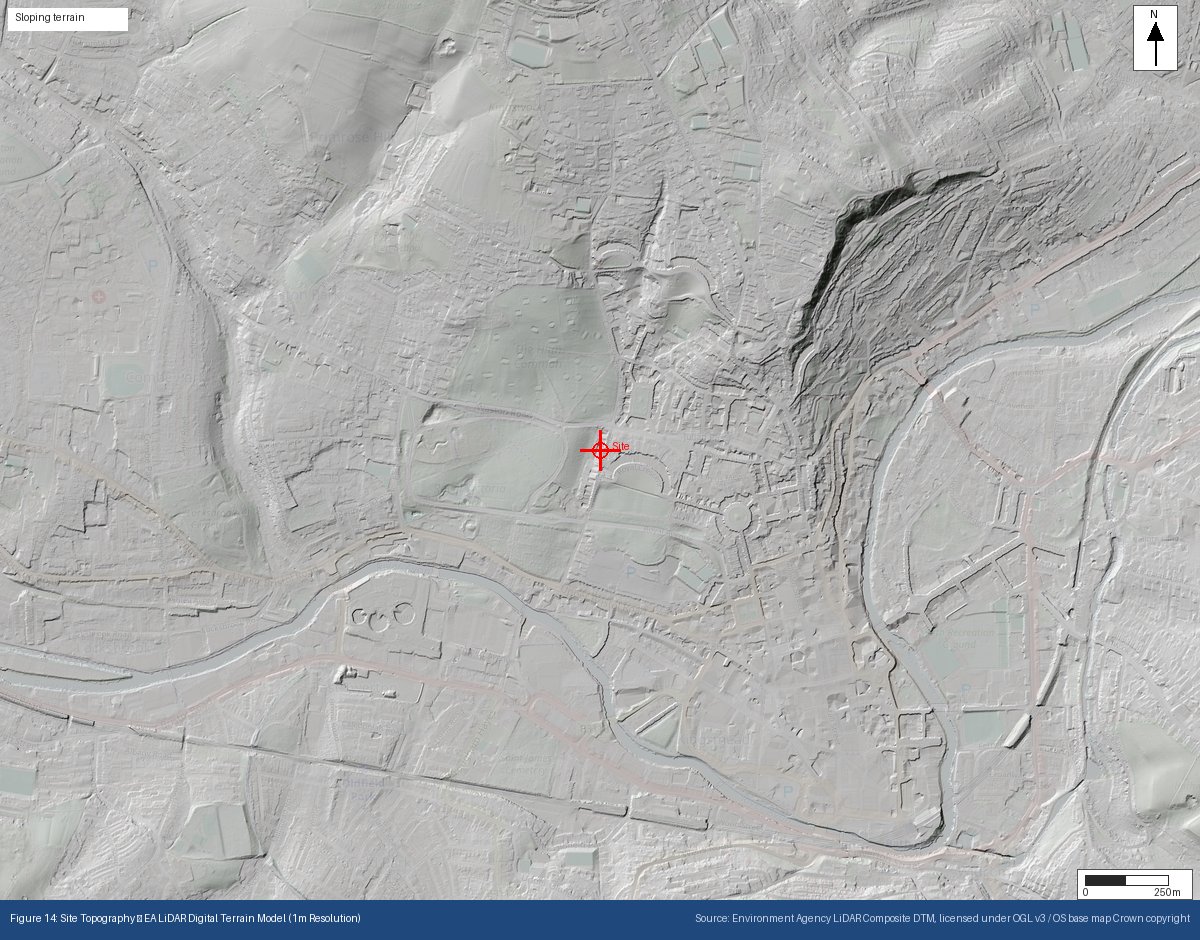
A LiDAR hillshade of Bath — sloping terrain is flagged automatically and is immediately visible in the terrain model itself, not just described in text.
5. Dissolution Features
Chalk, limestone, gypsum and salt are all soluble rock types, and dissolution within them can create cavities and subsidence — sometimes with very little surface warning. The Chalk of southern England, the Lias Group, and the gypsum-bearing Permian rocks of the north-east all require careful assessment. This reads from the same bedrock mapping shown in Figure 2 above.
6. Made Ground
Artificial fill — demolition rubble, colliery spoil, industrial waste, historic reclamation material — is common on brownfield sites and can be variable in composition, compressible, and potentially contaminated all at once. GeoScreen checks BGS superficial deposit mapping for made ground and artificial deposits at the site, alongside the historical land-use checks covered further down this post.
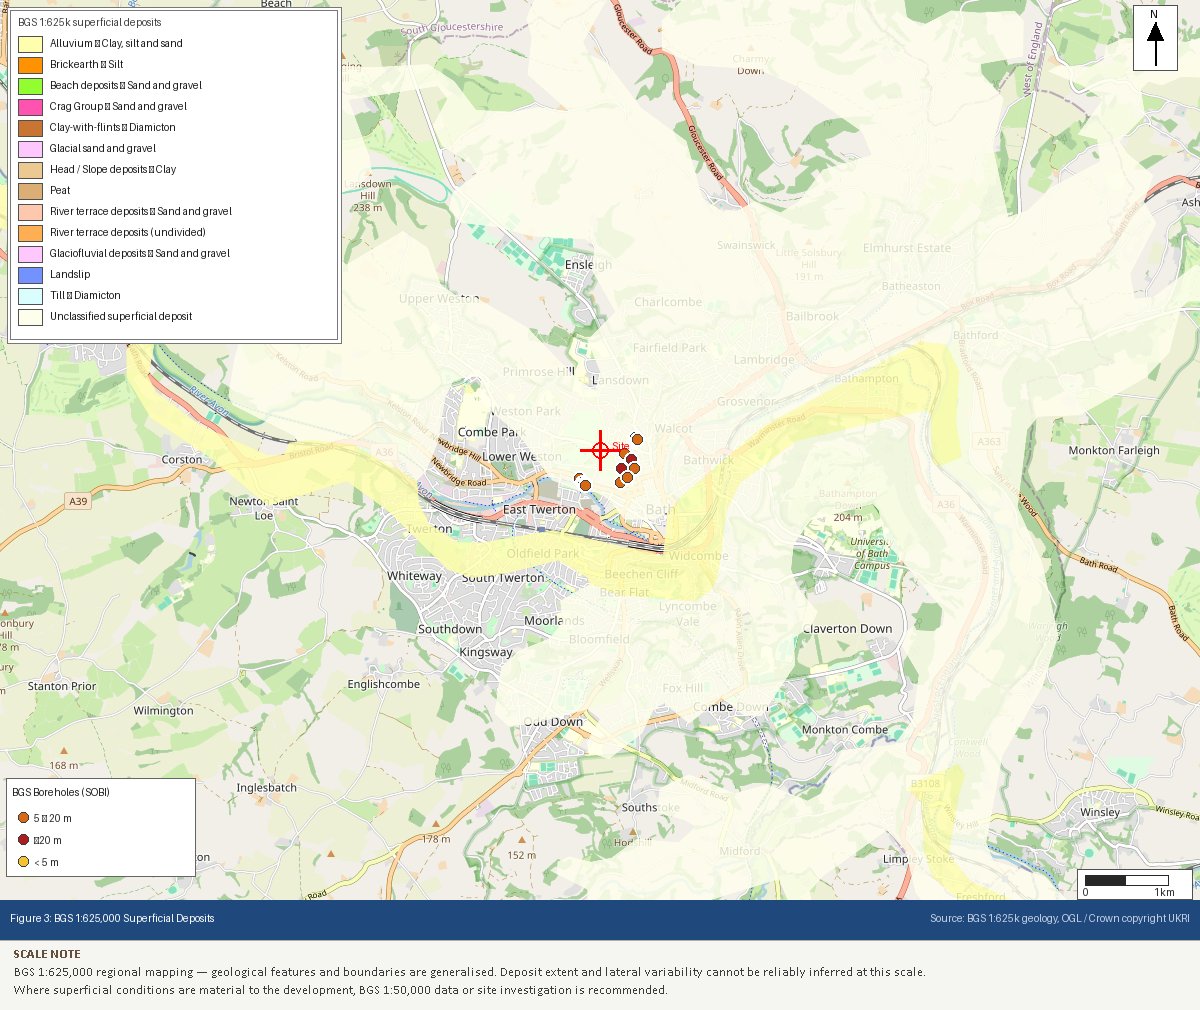
BGS 1:625,000 superficial deposits mapping for the same Bath site — alluvium, river terrace deposits, and other superficial units are shown alongside nearby BGS borehole records.
7. Flood Risk (Rivers and Sea)
The Environment Agency’s Flood Map for Planning — and Natural Resources Wales’s equivalent for Welsh sites — identifies Flood Zones 2 and 3. Development in either typically requires a Flood Risk Assessment, and in Zone 3, sequential and exception testing at the planning stage. This is one of the most visually direct hazards GeoScreen reports on: the mapped flood extent is drawn straight onto the site figure.
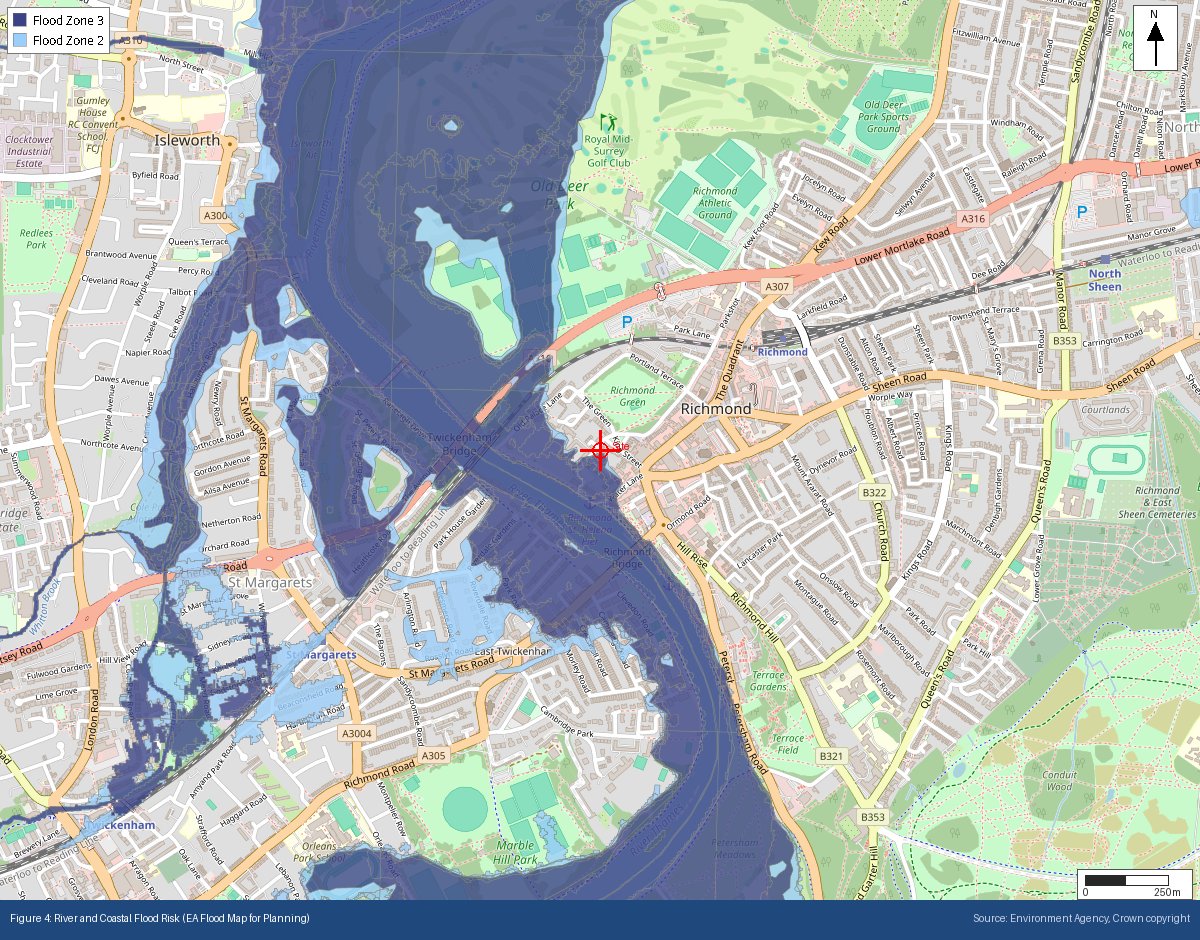
Richmond, on the Thames — Flood Zones 2 and 3 mapped directly against the site location.
8. Surface Water Flood Risk
Surface water flooding — water pooling or flowing away from a watercourse entirely, often from overwhelmed drainage during heavy rainfall — is a separate risk from river and coastal flooding, and can affect sites that sit safely outside any river Flood Zone. GeoScreen added this as its own dedicated check, drawing on the Environment Agency’s national surface water flood risk mapping (NAFRA2) in England and the equivalent dataset in Wales.
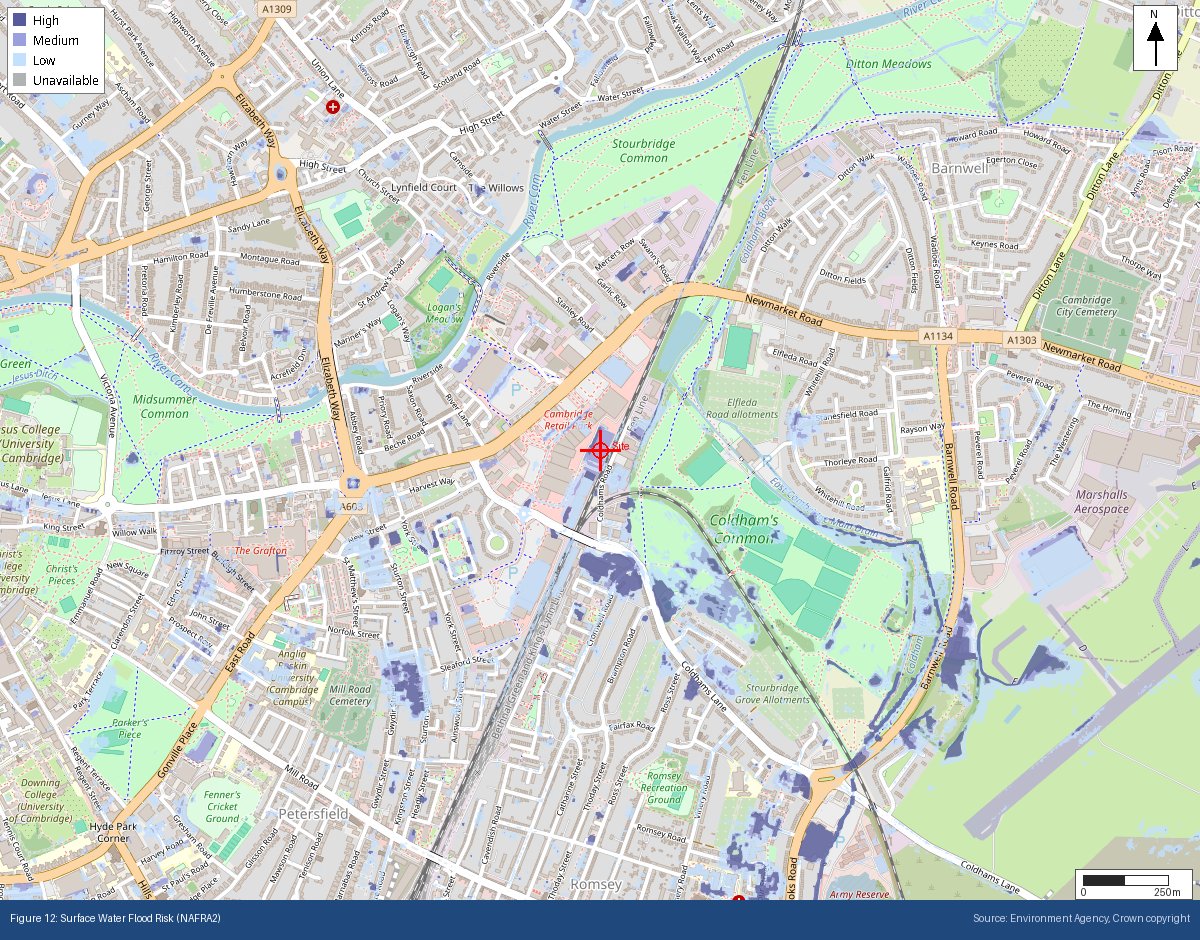
Cambridge — High, Medium and Low surface water flood risk bands mapped independently of the river flood zones covered above.
9. Radon
Radon is a naturally occurring radioactive gas that can accumulate in buildings if not designed for. BGS/UKHSA indicative mapping identifies radon potential across England and Wales as a percentage banding; Class 3 and above may require protective measures under BR 211:2015. GeoScreen reads the radon class directly at the site rather than for the surrounding postcode area as a whole.
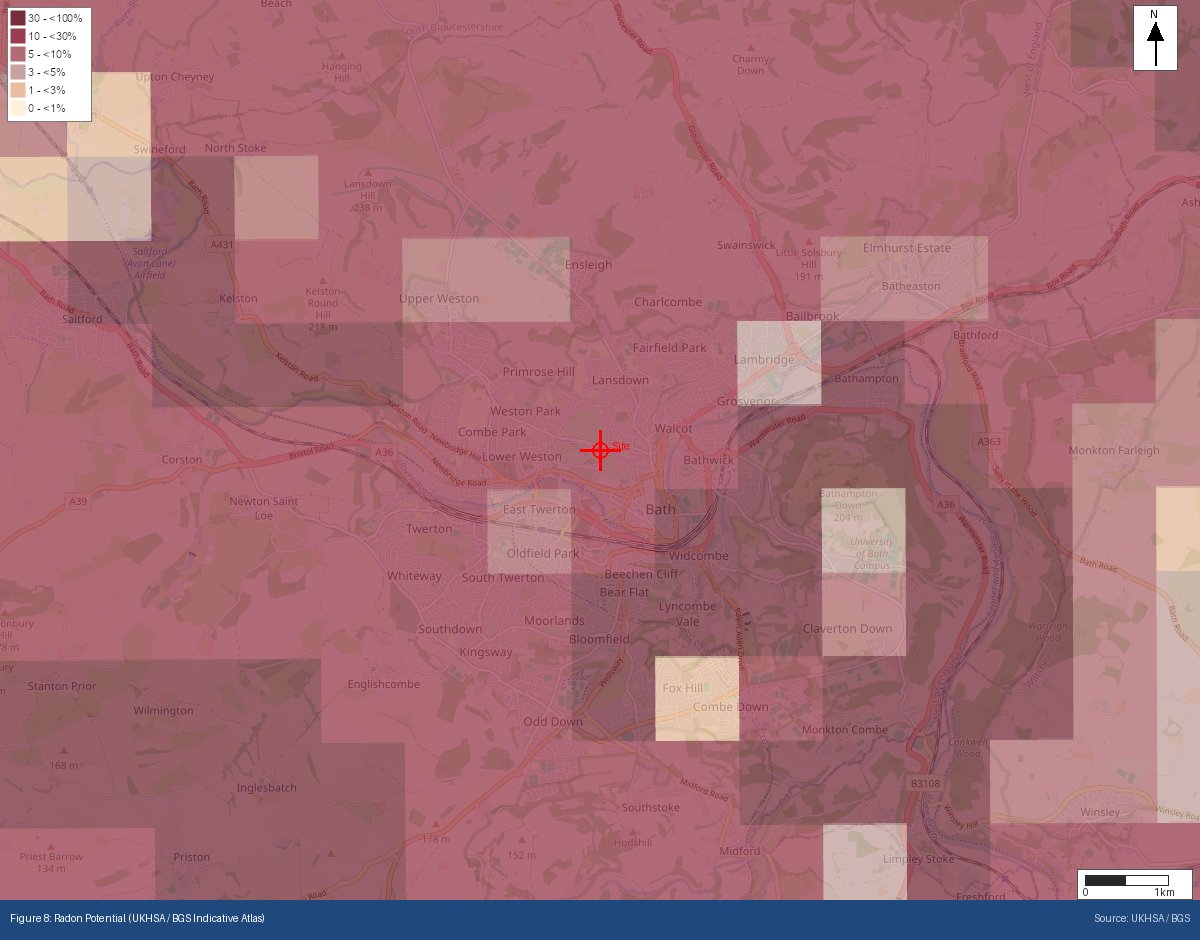
Radon potential banding around Bath — the site sits within a well-defined higher-potential band, one of the clearer examples of why site-specific readings matter more than a postcode-level generalisation.
10. Ground Gas
Methane and carbon dioxide can be generated by decomposing organic material, landfill sites, and coal-bearing geology — a risk that’s easy to miss if a site check doesn’t specifically look for nearby permitted and historic waste sites. GeoScreen cross-references Environment Agency (and NRW, in Wales) landfill and environmental permitting data alongside the coalfield and made ground checks above, so a site near a former landfill is flagged even when nothing about it looks unusual on the surface.
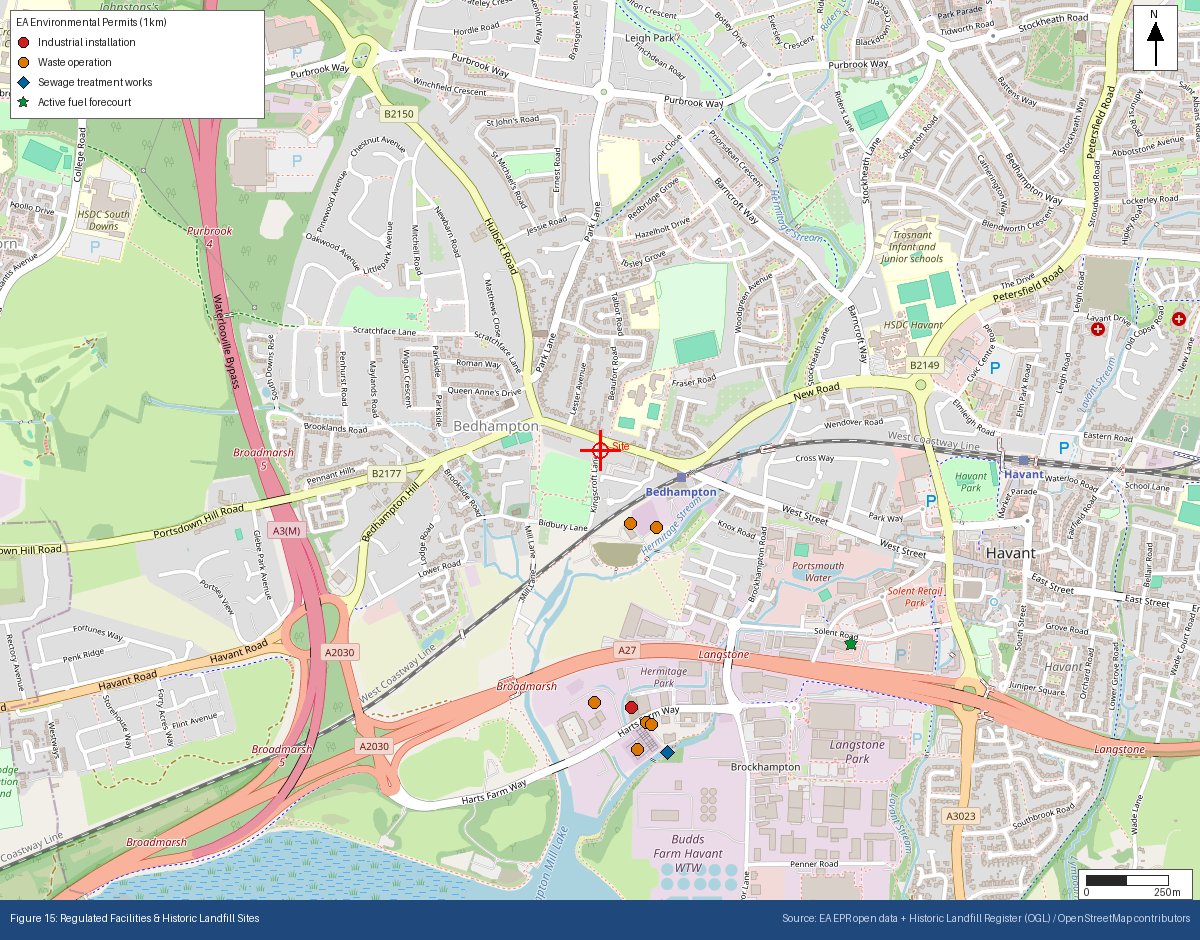
Bedhampton, Hampshire — permitted industrial installations, waste operations, sewage works and an active fuel forecourt, all mapped within 1km of the site.
11. Aggressive Ground Conditions
Sulfate- and sulfide-bearing ground can attack buried concrete over time if foundation design doesn’t account for it — a slow, easy-to-overlook risk rather than a dramatic one. It’s assessed from the same bedrock formation mapping used for shrink-swell and dissolution above, and where relevant, GeoScreen’s reports flag it against BRE Special Digest 1 design guidance.
12. Source Protection Zones
Not a geohazard in the geotechnical sense, but a genuine planning constraint: Source Protection Zones mark the ground around a public water supply borehole or spring, graded by how quickly contamination reaching that point of the ground could travel to the source. A site within Zone 1 or 2 can face real restrictions on what activities and discharges are acceptable, and this is one of the most commonly overlooked constraints in early-stage site appraisal — it doesn’t show up on a standard geology or flood check at all. GeoScreen checks this separately, via the Environment Agency in England and Natural Resources Wales in Wales.
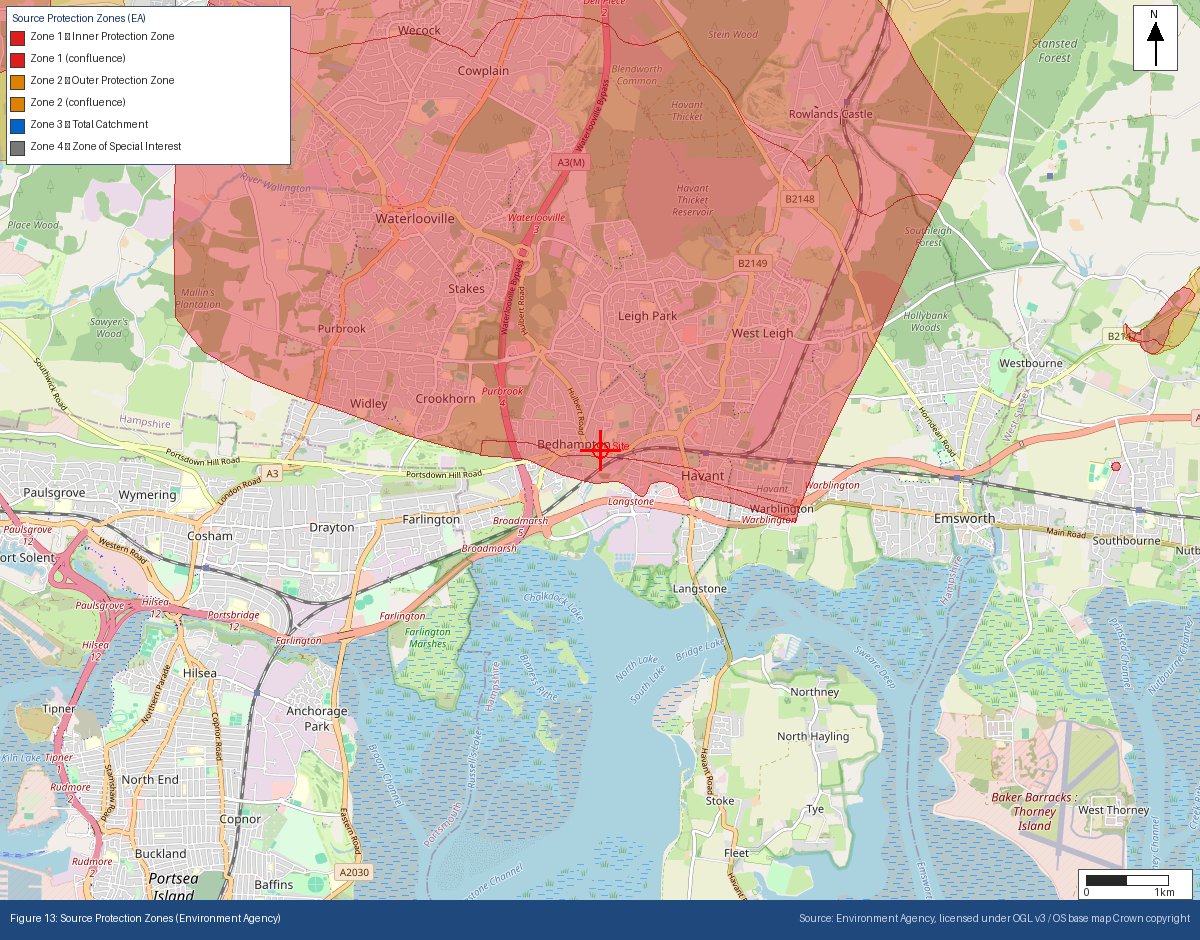
Bedhampton — Zone 1 (Inner Protection Zone) and Zone 2 (Outer Protection Zone) mapped in full, well beyond what a standard geology check alone would ever surface.
Why historical map data matters just as much as the geology
None of the twelve checks above will tell you that a site was once a gasworks, a chemical works, or a colliery yard — because that’s not a geological fact, it’s a land-use history fact. And it matters: former industrial land use is one of the single biggest drivers of contaminated land risk, and it’s often completely invisible in current geology mapping, aerial photography, or even a site walkover, because the buildings were demolished and the ground reinstated decades ago.
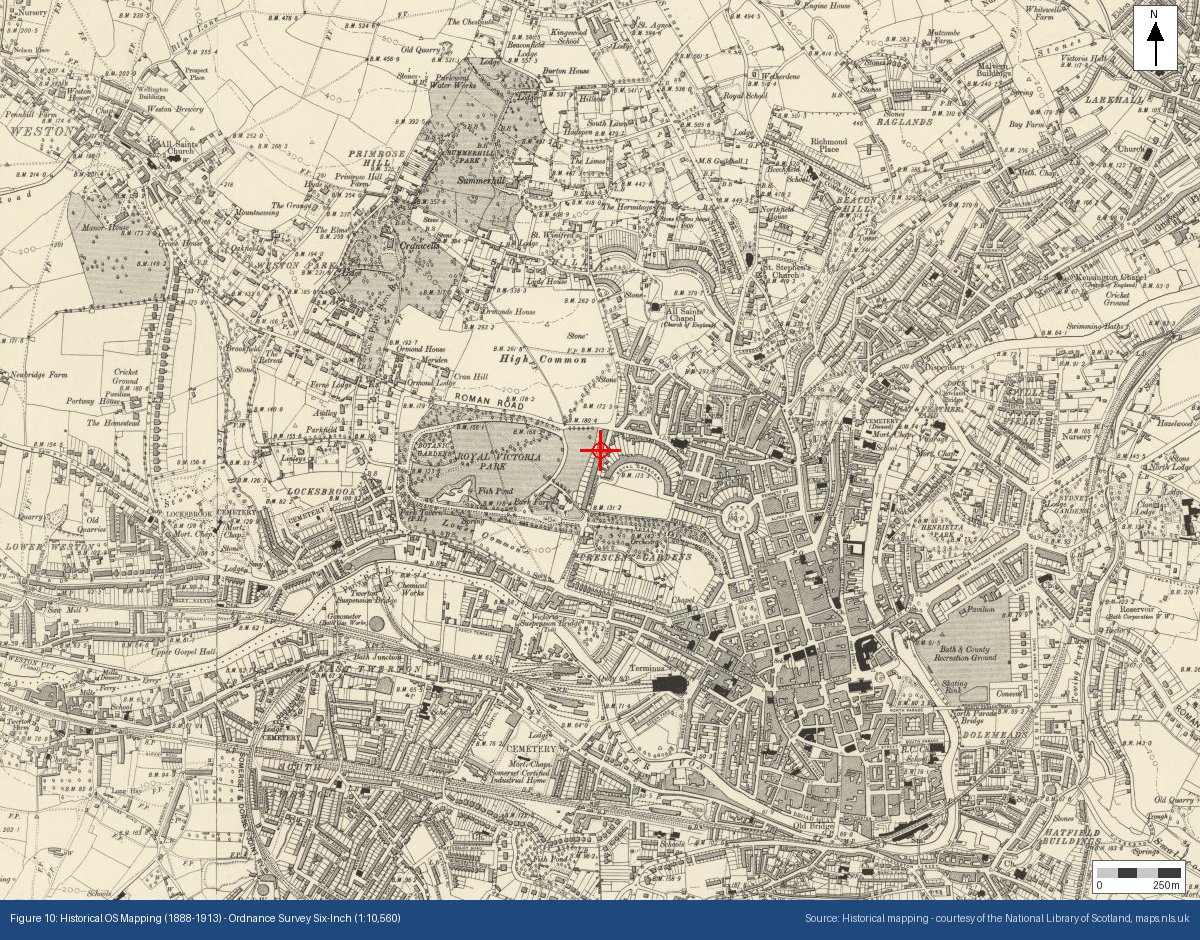
Ordnance Survey Six-Inch mapping (1888–1913) of the same Bath site — a “Chemical Works” and “Gospel Hall” both sit within the immediate vicinity, neither of which appears on any current map.
This is exactly why GeoScreen doesn’t stop at present-day data. Every report cross-references historical Ordnance Survey mapping (via the National Library of Scotland) against the GB1900 historical gazetteer — a crowd-transcribed, independently verified index of over a million map labels from that same historical survey — plus current OpenStreetMap data, to build a genuine historical and current features table for the site, not just a narrative description of what the AI happened to notice on a scanned map image.
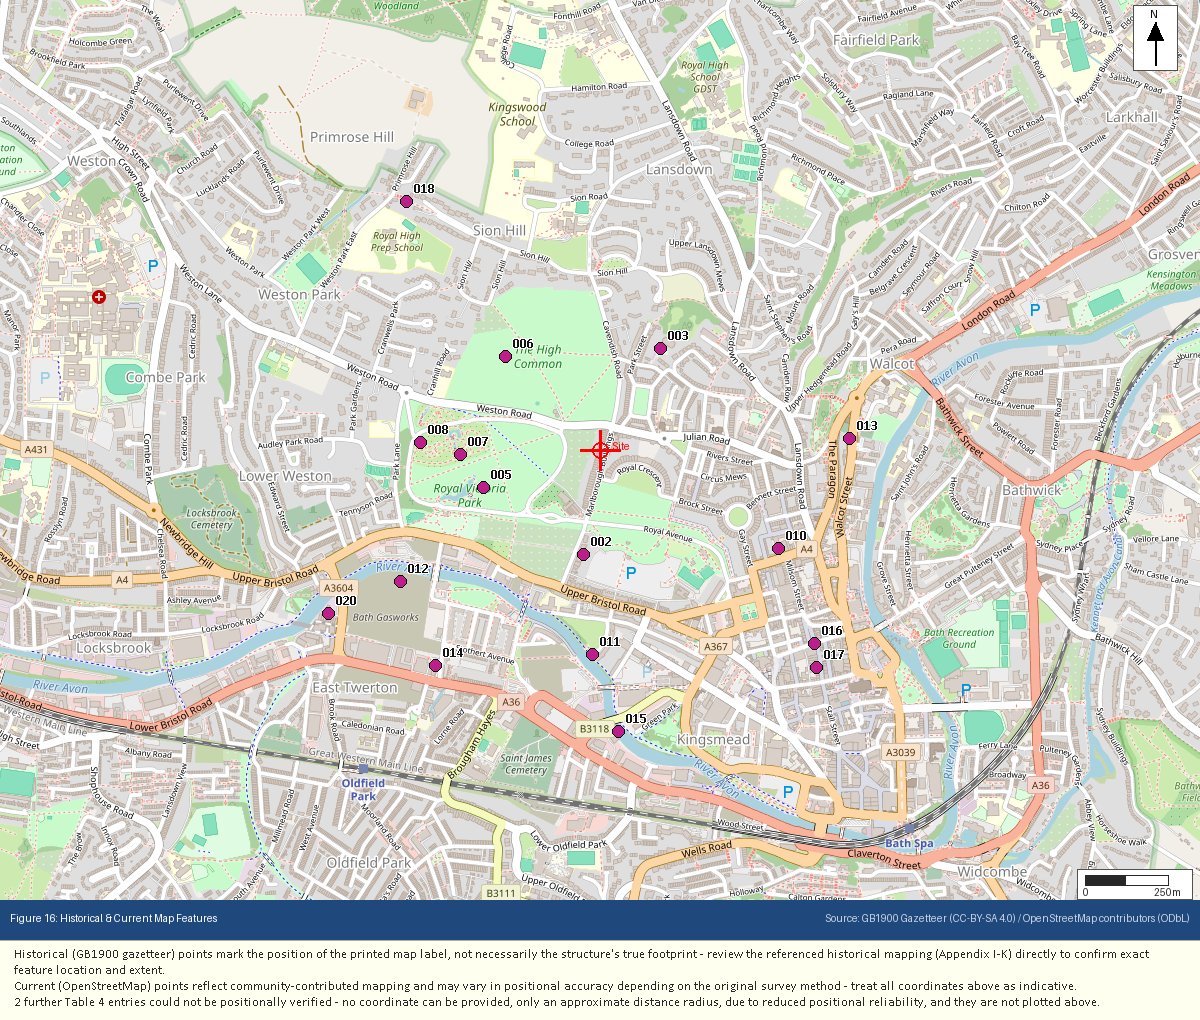
The same Bath site’s historical and current features, cross-referenced and individually numbered — including “Bath Gasworks,” a genuine former industrial site 500m from this location.
This is one of three data points we’ve written about before that most manual desk-based reviews miss entirely, alongside historic landfill registers and Environment Agency regulatory permits. If you haven’t already, it’s worth reading Three datasets every site assessment should check — but most miss for the other two.
Ground risk assessed. England and Wales. From £75.
Every one of the twelve checks above runs automatically, on every GeoScreen report, for any site in England or Wales — no manual data-gathering, no waiting on third-party report turnaround. Order a report at geoscreen.uk →
— Tristan Morgan BSc(Hons) EurGeol CGeol FGS AMICE, UK Registered Ground Engineering Specialist, Director of Magnum GSI Ltd
