


What’s Buried Beneath Your Site? GeoScreen Now Checks.
A few weeks ago, a GeoScreen user asked us a simple question:
“Does this tell me if there’s a tunnel or underpass near my site?”
At the time, the honest answer was no.
Not because the question wasn’t important. Quite the opposite. The presence of tunnels, underpasses and other buried structures can be highly relevant to understanding site constraints and ground conditions. The real challenge was that there is no single, comprehensive dataset covering underground structures across Great Britain. Information is fragmented across multiple sources, historical records are often incomplete, and many buried features have never been formally recorded.
That makes buried infrastructure far harder to identify than most of the hazards and constraints typically screened during a desk study.
Why This Was Harder Than It Sounds
Most of what GeoScreen checks is relatively straightforward from a spatial perspective.
A substation is a point on a map.
A former gasworks is a point on a map.
A listed building is a point on a map.
For these types of features, the question is simple:
How far is it from the site?
A tunnel isn’t a point. It’s a line, sometimes extending for hundreds of metres or even kilometres beneath roads, rivers and developments that may give no indication of what’s below.
Determining whether a tunnel is relevant to a site isn’t simply a distance calculation. It’s a geometry problem.
This is exactly the sort of issue that often gets overlooked by automated screening tools, not because it isn’t important, but because it is considerably more difficult to implement reliably.
Adding to the challenge, buried structures come in many forms. They may be associated with historic transport routes, railway infrastructure, pedestrian underpasses, culverted watercourses, utility corridors, service tunnels or other underground works. No single dataset captures them all.
As a result, any assessment of buried structures will always be partial rather than comprehensive.
What We Built Instead
Rather than ignore the problem, we looked at how we could provide the best possible answer using the highest-quality data available to us.
The solution combines two independent datasets.
The first is historical: the GB1900 Gazetteer, a crowd-transcribed record containing more than one million place and feature names taken from Ordnance Survey six-inch maps published between 1888 and 1913.
Where a tunnel, subway or similar feature was identified and labelled on those historical maps, GeoScreen can now find it. Because these records originate from surveyed map annotations rather than AI interpretation of scanned imagery, positional reliability is significantly improved.
The second source is current: a purpose-built extract of OpenStreetMap’s tunnel and subway data, covering modern mapped infrastructure.
Together, these datasets allow GeoScreen to identify:
- Railway tunnels
- Road tunnels
- Subway infrastructure
- Pedestrian underpasses
- Tunnel entrances
- Culverted watercourses
within 1 kilometre of a site boundary.
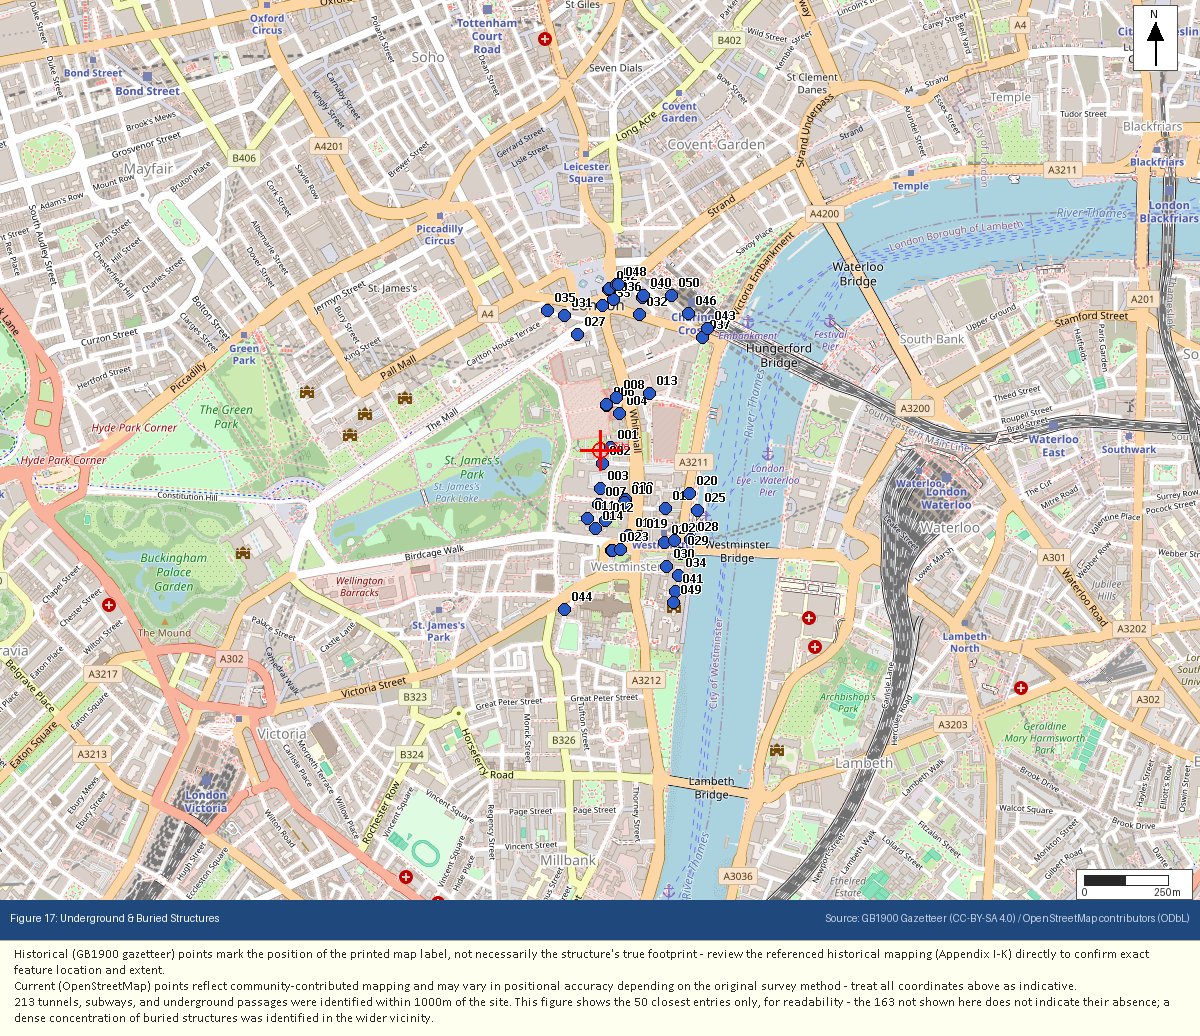
Each feature is presented with an approximate grid reference, plotted on a dedicated figure, assigned a unique identifier, and cross-referenced to a structured table within the report.
What It Can’t Tell You — And Why We Say So
This is arguably the most important part of the enhancement.
Historical mapping and OpenStreetMap provide valuable information about public infrastructure. They do not provide complete visibility of everything beneath a site.
Private utility infrastructure, service tunnels, cable routes, pipelines and other assets deliberately excluded from public mapping for operational or security reasons will not appear in these datasets.
For that reason, GeoScreen does not present buried structure screening as a substitute for a utility search.
Where buried services are a significant project consideration, a dedicated utility search remains an essential part of the due diligence process.
Equally, where the available data only provides an approximate location, GeoScreen makes that limitation clear. Rather than presenting a misleadingly precise map position, the report explicitly communicates uncertainty where uncertainty exists.
Transparency is more valuable than false precision.
What This Means for Your Report
Every Tier 1 GeoScreen report now includes a dedicated Underground and Buried Structures section.
This contains:
- All identified buried structures within 1 kilometre of the site
- Approximate grid references
- Distance measurements
- Numbered entries sorted by proximity
- Cross-referenced mapping figures
- Clear explanations of data sources and limitations
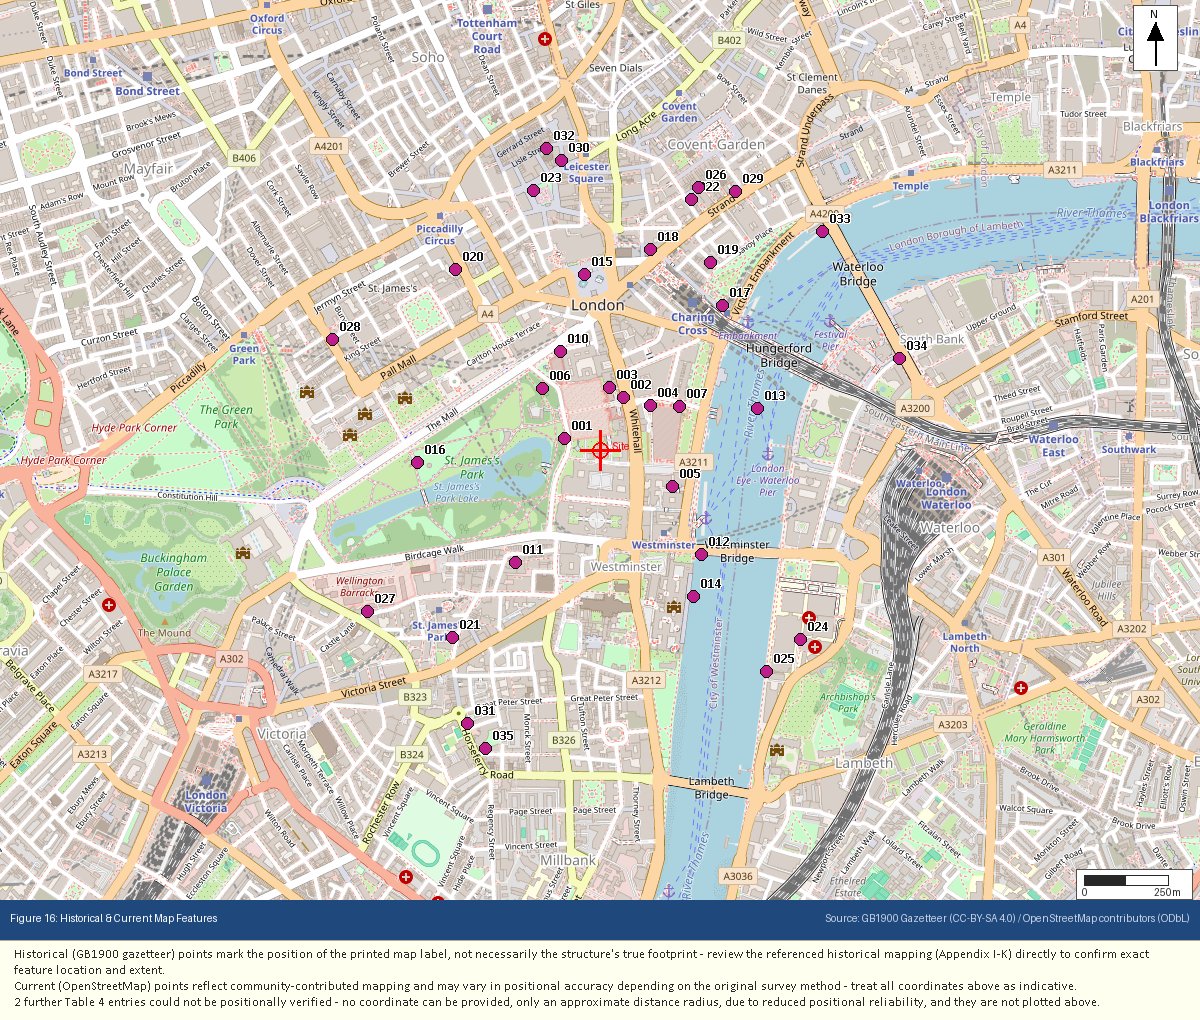
The same update also added a companion figure for the report’s existing Historical Features table: every entry it lists — former industrial sites, historic map labels, current infrastructure — is now plotted and numbered on its own dedicated map (Figure 16, Appendix P), the same visual treatment the buried structures table now gets from Figure 17.
Tier 0 Ground Risk Snapshot reports now also include the buried structures mapping figure, allowing users to quickly identify whether underground infrastructure warrants further investigation.
Despite these additional checks, report generation remains fully automated.
GeoScreen can still assess a site in around 90 seconds, meaning users benefit from expanded buried structure screening without any increase in turnaround time. As with all GeoScreen enhancements, the functionality scales automatically across thousands of site assessments.
The Same Thinking Led to Improvements in Mine Shaft Screening
While revisiting underground infrastructure data, we also reviewed GeoScreen’s existing mine entry detection.
That review identified two opportunities for improvement.
Better Classification
The Mining Remediation Authority dataset differentiates between several types of mine entry, including:
- Shafts
- Adits
- Gutter pits
Previously, GeoScreen only interpreted a subset of these entries.
Now, each feature is reported according to its actual recorded type, providing a more accurate representation of historic mining features near a site.
Improved Detection in Mining Areas
The second improvement relates to areas with dense mining heritage.
Where multiple shafts and adits occur in close proximity, detection has been refined to ensure individual entries are recognised separately rather than grouped together.
On some heavily mined sites, this increased the number of identified entries from only a handful to several dozen, providing a significantly more complete picture of local mining legacy features.
Enhanced Mine Entry Reporting
Every Tier 1 report now includes a dedicated Recorded Mine Shafts table containing:
- Every identified mine entry within 500 metres of the site
- Entry type
- Approximate grid reference
- Distance from the site
- Individual numbering and cross-referencing
As with buried structures, the report also explains the limitations of the dataset.
Mine entry positions are approximate and derived from mapped records rather than surveyed coordinates. The data does not include information such as:
- Depth
- Diameter
- Treatment history
- Colliery name
- Structural condition
Where this level of detail is required, the report directs users towards a CON29M Coal Mining Search and, where appropriate, a Consultants Coal Mining Report from the Mining Remediation Authority.
One Question, One Improvement
It started with a simple customer question.
Today, every GeoScreen report benefits from the answer.
The result is broader buried structure screening, improved mine entry detection, clearer visibility of underground infrastructure, and greater transparency about what the data can and cannot tell us.
Because good desk studies aren’t just about finding risks.
They’re about being honest about the limits of the evidence too.
