


GeoScreen now covers Scotland. You can order a report for any site in England, Wales or Scotland, at the same price, with the same hazard ratings and the same 18 figures.
When we added Wales in the summer, most of the work was swapping data sources: Natural Resources Wales instead of the Environment Agency, Cadw instead of Historic England, Planning Policy Wales instead of the NPPF. The systems were close enough that the questions stayed the same. Scotland was different. In several places Scotland doesn’t just publish the data somewhere else, it does the job a different way, and that meant making some engineering decisions rather than just plugging in a new source.
This post goes through what’s the same, what’s different, and where we had to make a judgement call.
What stays the same
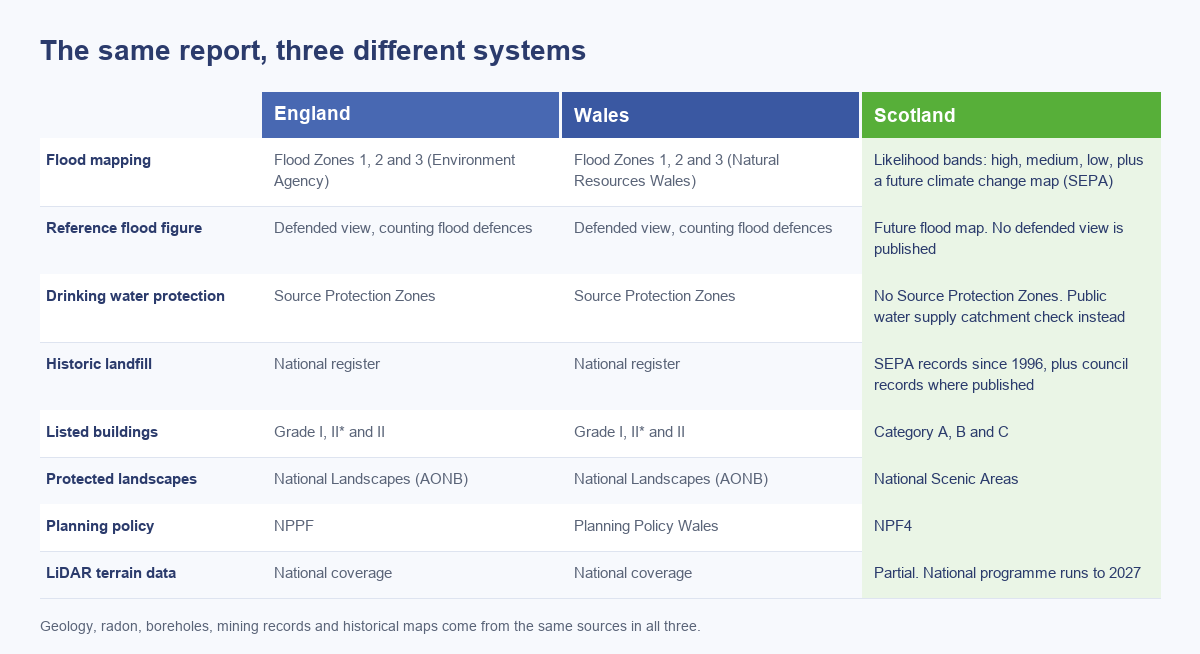
A lot of the data GeoScreen uses already covered the whole of Great Britain. BGS geology, radon, boreholes and faults all work the same in Scotland. The Mining Remediation Authority covers the Scottish coalfields, and Scottish councils ask for Coal Mining Risk Assessments in the same way English ones do. The historical maps come from the National Library of Scotland anyway, so Scottish coverage is as good as anywhere. The report structure, the rating rules and the price don’t change.
Flood risk: no Flood Zones
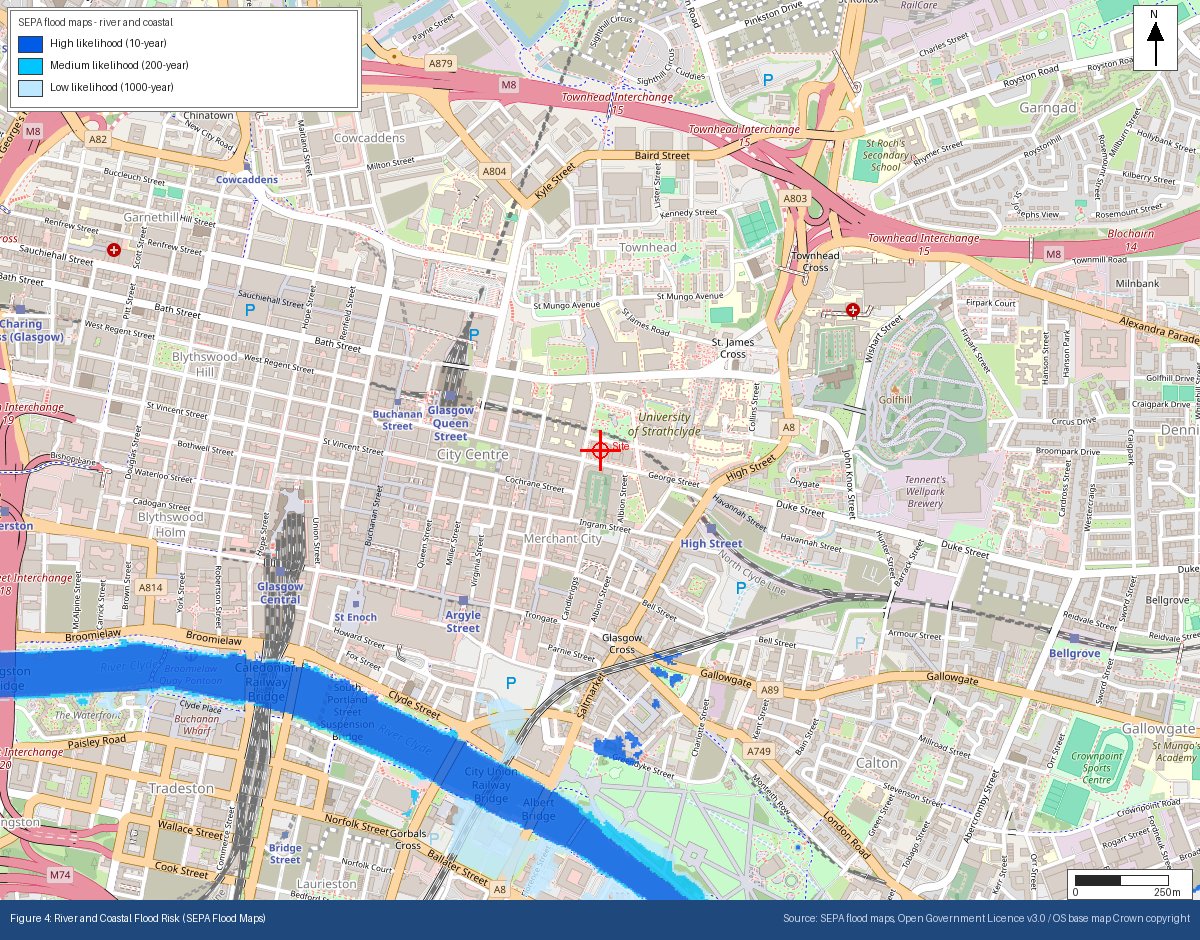
This was the biggest change. England and Wales use Flood Zones 1, 2 and 3. Scotland doesn’t. SEPA maps flooding by likelihood instead: high (roughly a 1 in 10 chance each year), medium (1 in 200) and low (1 in 1,000), plus a future medium map that adds climate change.
So we had to decide what counts as High. National Planning Framework 4 defines a flood risk area as land at the 1 in 200 year level including climate change, and SEPA points to its future flood map as the best guide to that. A Scottish site in GeoScreen is rated High if it falls inside either the 1 in 200 year extent or the future medium extent. That lines up reasonably well with Flood Zone 3 in England.
The reference flood figure changes too. In England and Wales it shows the defended view, the one the public flood checkers use, alongside the planning map. Scotland has no equivalent defended product, so in a Scottish report that figure shows SEPA’s future flood map instead. It’s there for reference and doesn’t change the rating.
No Source Protection Zones
England and Wales draw Source Protection Zones around public water supply boreholes and springs, and GeoScreen rates them. Scotland doesn’t map them. Every body of groundwater in Scotland is a Drinking Water Protected Area, which means the designation can’t tell one site from another.
Rather than drop the check, we replaced it with a Public Water Supply Catchment check. It looks at Scottish Water’s supply catchments and SEPA’s designated drinking water rivers and lochs. A site within 50 metres of one of those rivers or lochs is rated Medium, and a site inside a Scottish Water catchment is rated Low. Most of those supplies come from surface water rather than boreholes, so it isn’t a like-for-like replacement for an English SPZ, and the report says so. Where it matters, it points you to Scottish Water, which is who you’d speak to anyway.
On a related note, Scotland doesn’t use the English aquifer designations (Principal, Secondary A and so on), so Scottish reports describe groundwater using the BGS productivity classes instead.
Historic landfill: the biggest gap
England has a national Historic Landfill register. Wales has an equivalent from NRW. Scotland doesn’t have a single one. SEPA’s records cover every landfill it has licensed since 1996, including sites whose licence has since ended, and GeoScreen checks those. But tips that closed before 1996 were never under SEPA, and the only records of those are held by councils.
Some councils do publish their records, either directly (Edinburgh does) or through the Spatial Hub, the national layer compiled from council data. But only a minority of councils have ever contributed. So a Scottish report tells you, for the council the site is in, whether older landfill records exist and have been included, or whether none are published. I’d rather a report says plainly that the data isn’t there than give you a clean result that only looks clean because nobody recorded anything. The historical map review and the GB1900 gazetteer still pick up old tips and refuse pits where they were labelled on the maps.
Heritage, ecology and planning
These are mostly a change of names, but they matter in a report that a planner might read. Listed buildings in Scotland are Category A, B or C rather than Grade I, II* or II. Heritage data comes from Historic Environment Scotland. Scotland’s equivalent of an AONB is a National Scenic Area, and ecological designations come from NatureScot. The planning policy is NPF4 and the Local Development Plan, and what England calls a Habitats Regulations Assessment is an Appraisal in Scotland. Radon guidance points to the Scottish building standards rather than the English Approved Documents.
We also added ratings for the main Scottish geological units, which didn’t exist in the system before because none of them occur in England or Wales. The Carboniferous rocks of the Midland Valley (the Clackmannan, Strathclyde and Scottish Coal Measures groups) carry limestone bands, coal and pyritic mudstones, so they now feed the dissolution, ground gas and aggressive ground ratings. The raised marine deposits along the Forth and Clyde get a compressible ground rating, with a note about the soft carse clays that can sit within them.
LiDAR coverage is patchy for now
England’s terrain data comes from one national service and Wales publishes one national file. Scotland’s public LiDAR comes as around 12,000 separate tiles from different surveys, and a national programme to fill the gaps runs until 2027. GeoScreen uses the newest and best tile available for each site. Where there isn’t one, the report says LiDAR isn’t yet available for that location rather than leaving the figure blank. Our Aberdeen test site was one of those.
How we tested it
We built a Scottish test set of seven sites, chosen to cover different problems: Glasgow, Edinburgh, Aberdeen, Perth, Kirkcaldy, Oban and Balloch on Loch Lomond. Each one was run as both report tiers and checked line by line, along with every figure. We reran the full England and Wales test set at the same time, 40 reports, and none of their ratings changed.
The figure check found one real problem. SEPA’s future flood map includes grey areas where climate change data isn’t available, and GeoScreen was treating those as flood extents. A site inside one of those areas would have been rated High for flooding when SEPA hadn’t actually said anything about it. It’s fixed: those areas are no longer counted, and the report says when a site sits inside one.
If you want to see what a Scottish report looks like, there’s a Glasgow sample on geoscreen.uk. It’s a city centre site rated High, mainly for mining legacy and surface water flooding.
