 Magnum GSI
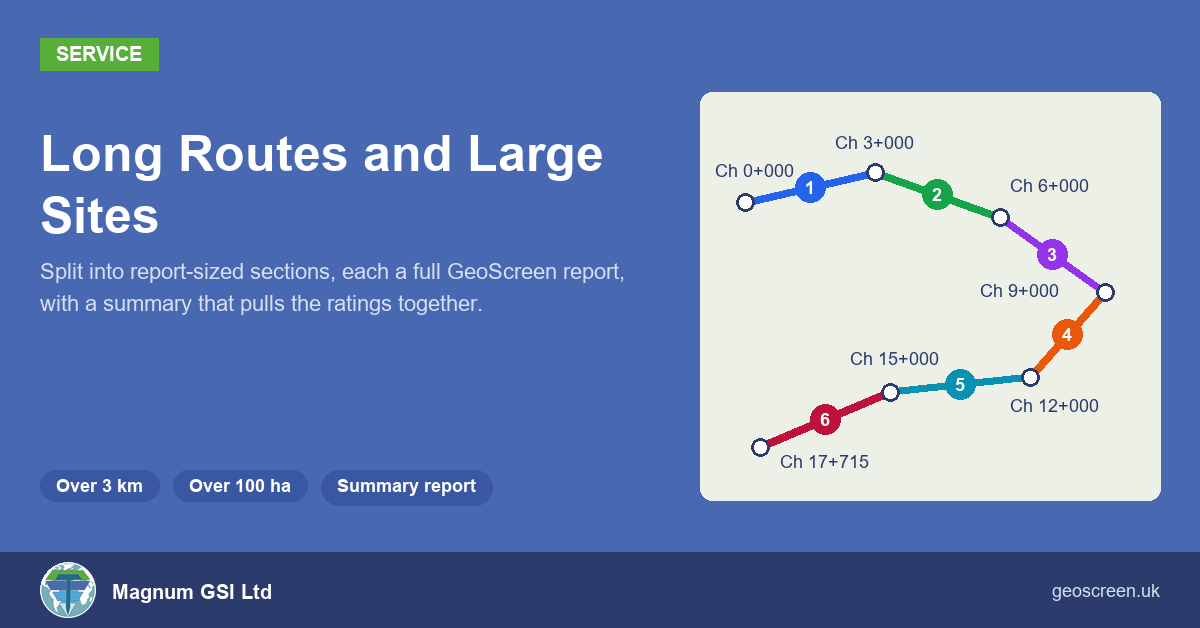
When we added site boundaries and routes to GeoScreen, we set two limits on the order form: 100 hectares, and 3 km end to end. A report is built around maps at a scale you can actually read, and past about 3 km those maps stop working.
Plenty of real jobs are bigger than that. A cable route can run for 20 km, and a large site boundary can be several hundred hectares. So rather than turn those away, we now take them on as custom jobs. The route or site is split into report-sized sections, each section gets its own full GeoScreen report, and a summary report on top pulls the ratings together.
How it works
You send us the route or boundary, ideally as one simple line or outline in a KMZ, KML or GeoJSON file. We work out how many sections it needs and talk you through the options before anything is run.
A route is cut into 3 km sections, with a shorter one at the end, or into equal sections if you’d rather. A large boundary is cut into parts of no more than 100 hectares, normally on a 1 km grid. If the job crosses the border between England and Wales or England and Scotland, it’s split at the border first, because each country has its own data and planning policy.
Each section is a normal GeoScreen report. It has all 18 figures, every table and the full rating for every hazard, exactly as if you’d ordered that section on its own. The whole job is either Tier 1 or Tier 0, not a mix. The chainage carries on from one section to the next, so Section 2 starts where Section 1 ends, at Ch 3+000, and every distance and stretch in it uses the full route’s chainage.
A test route in Weardale
To test it, I drew a 17.7 km pipeline route near our office in Weardale, starting near Eastgate, running east to Stanhope, then back west along the south side of the valley to Westgate. It split into six sections: five of 3 km and a last one of 2.7 km. Each section took about two minutes to run, so the whole route took about twelve.
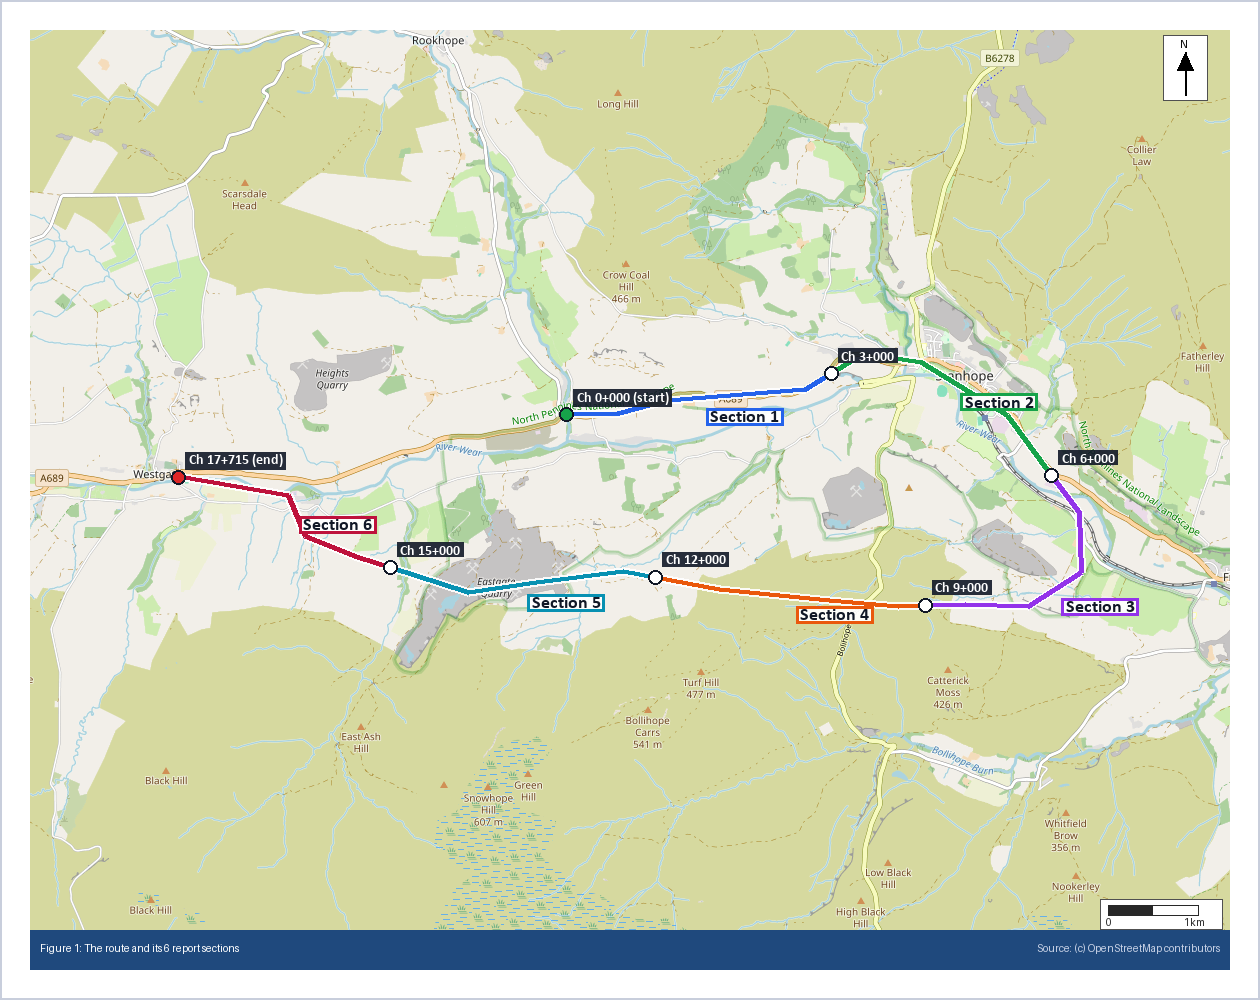
It’s not an easy route, which is why I picked it. It crosses old lead and limestone workings, two recorded landfills and the River Wear flood plain, and it climbs steep valley sides. Five of the six sections came out Very High overall. The interesting part is where along the route each hazard sits. Slope Instability is Very High in Sections 2, 3 and 5, where LiDAR picks up slopes of over 30 degrees. The landfills are in Sections 1 and 5. Section 4, across the higher ground to the south, is the only one rated High rather than Very High.
The summary report
Six reports are a lot to read through, so for any job of four sections or more there’s a summary report on top. Its main page is a table with one row per section and one column per hazard, so you can see at a glance which stretches are driving the risk.
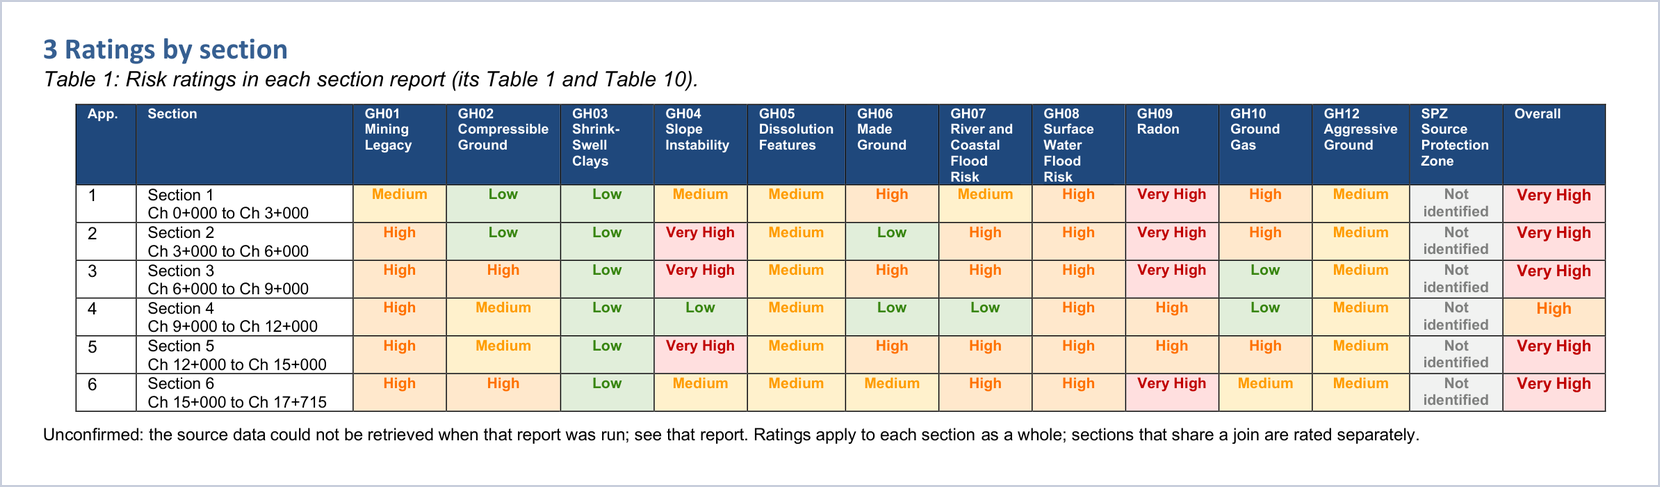
After the table, it lists each hazard’s highest rating and where it occurs, for example “Slope Instability is rated Very High in Sections 2, 3 and 5 (Ch 3+000 to Ch 9+000 and Ch 12+000 to Ch 15+000)”. It then lists the key findings for every High and Very High hazard, section by section.
One decision matters more than the rest. The summary is put together entirely by rule. There’s no AI in it, and it doesn’t assess anything itself. Every rating and every key finding is copied word for word from the section reports, and the summary says that if it ever differs from a section report, the section report is the one to rely on. The worst outcome would be a summary saying something the reports underneath don’t, so it’s built so that it can’t.
Where the sections meet
The obvious weak point in splitting a route is the joins. A hazard sitting right at Ch 3+000 belongs to two reports. Each section’s figures therefore show the neighbouring sections in grey, with a label at each end saying which section comes next, so nobody reading Section 5 forgets there’s a Section 4 and a Section 6.
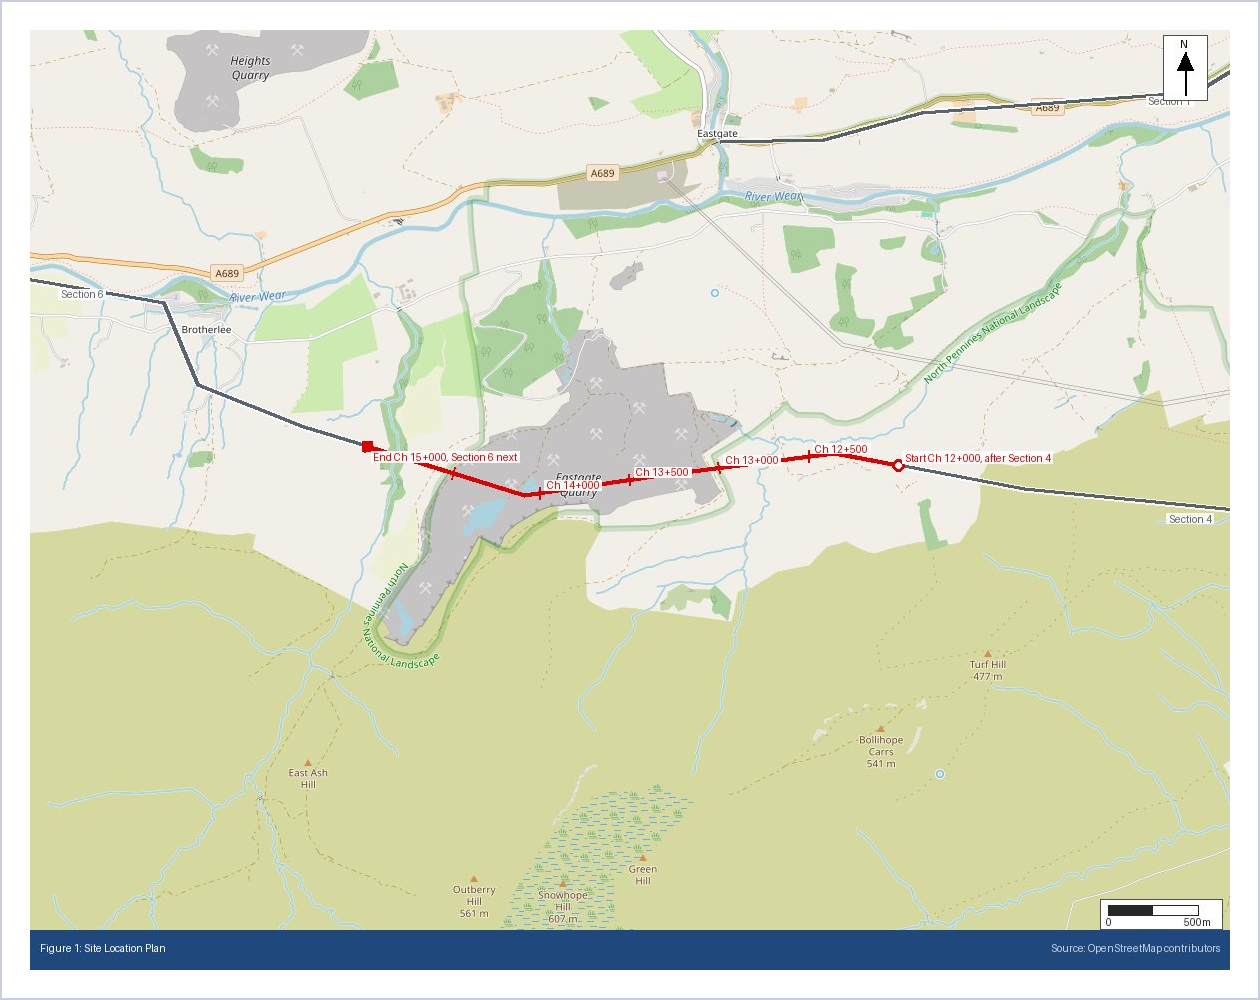
Each section is still rated on its own, so a hazard just over a join may only appear in the report on that side. The summary report says so, and it’s worth reading the reports either side of a join together.
Why not one long report?
I did look at producing a single report for a whole long route. The problem is the maps. Every figure in a GeoScreen report is drawn around the site at a scale where you can read street names and field boundaries. A 20 km route at that scale would need each of the 18 figures split into several panels along the route, well over a hundred figure pages, or one zoomed-out map where the detail you’re paying for disappears. Several of the data searches would also need reworking for an area that size. Separate sections at a readable scale, with one summary over them, give you everything a single report would, and more clearly.
What you get
You get the section reports as Word files in a zip, plus one combined PDF with the summary first and each section report after it as an appendix, each with its own cover page and bookmark. There’s also a spreadsheet of the ratings by section. The PDF for the six Weardale sections is about 25 MB, so we share it by link rather than email.
Because every long route or large site is different, these are custom jobs rather than something you order through the website. If you have a route like this, send it over and we’ll review it with you and discuss the pricing options before anything is run.
Wider corridors, for every route report
Two smaller changes came out of this work and apply to every route report, not just long ones. You can now choose a corridor of 30, 50 or 100 metres as well as 5 to 20 metres, for motorway and railway schemes where the land take is much wider than a cable trench. “Railway scheme” is now one of the route uses, alongside pipeline, cable, road scheme and utility corridor. With a wider corridor, the road and railway crossings, the geology sampling and the ground checks all use the full corridor width, not just the centre line.
If you have a route over 3 km or a site over 100 hectares, send me the file and we’ll review it and discuss the pricing options with you. Anything inside the limits can be ordered directly at geoscreen.uk.
