 ASSETS_(Mar 21)")

How GeoScreen Works — The Technology Behind a 90-Second Ground Risk Report
When people hear that GeoScreen delivers a Tier 1 Preliminary Ground Risk Screening Report — a fully automated desk-based assessment — in around 90 seconds, the first question is simple:
How?
A manually produced desk study typically takes a competent geotechnical engineer one to two days. What GeoScreen does differently is not simpler — it is faster, parallel, and structured.
Here’s what’s actually happening under the hood.
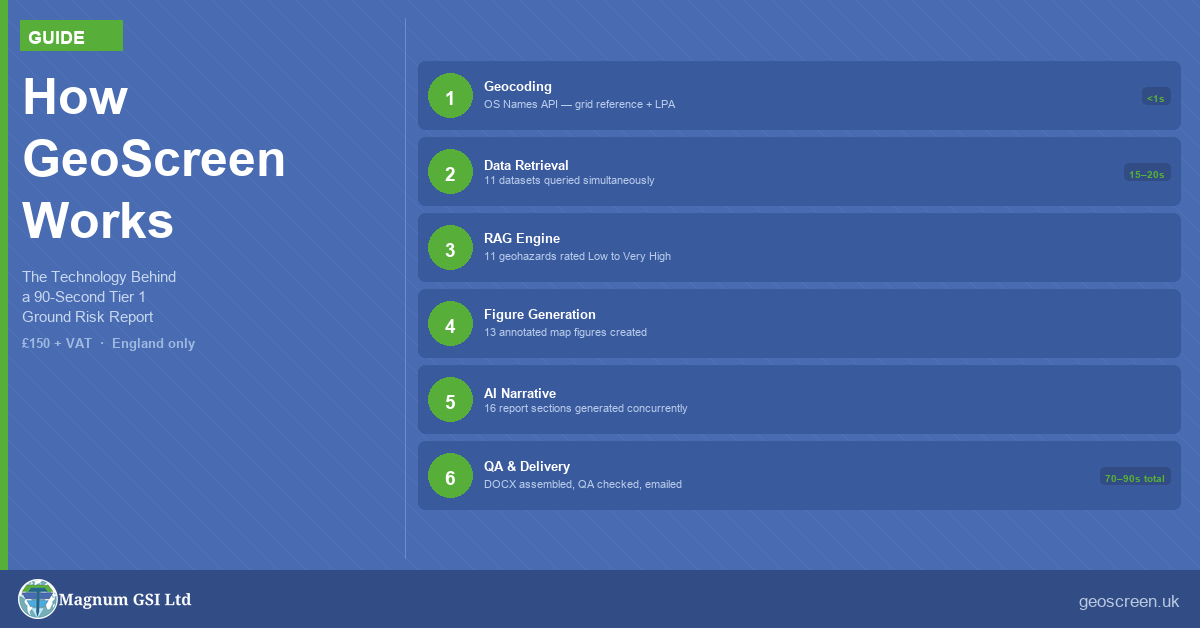
Step 1 — Geocoding
When a site address is submitted, GeoScreen queries the Ordnance Survey Names API to resolve it to a precise OS National Grid Reference (easting and northing).
This coordinate becomes the anchor for every subsequent data query. At the same time, the system identifies the relevant Local Planning Authority.
This step typically completes in under one second.
Step 2 — Parallel Data Retrieval
GeoScreen then queries eleven publicly available datasets simultaneously — all in parallel rather than sequentially.
These include:
- BGS 1:625,000 geological mapping — bedrock and superficial geology via BGS OGC API and WMS services
- BGS borehole records (SOBI) — identifying historical ground investigations within 500m
- BGS radon potential dataset — radon classification at the site location
- BGS fault data — mapped fault lines within the study area
- Environment Agency Flood Map for Planning — river and coastal flood zone classification
- Environment Agency NAFRA2 — surface water flood risk at the site location
- Environment Agency Source Protection Zones — groundwater protection designations
- Environment Agency landfill datasets — permitted and historic landfill sites within 500m
- Mining Remediation Authority data — Development High Risk Areas and mine entry records
- Historic England NHLE — listed buildings, scheduled monuments, and conservation areas within 500m
- Natural England datasets — six layers covering SSSI, SAC, SPA, Ramsar, AONB, and National Park designations
Because all queries are executed concurrently, the entire data gathering phase typically completes within 15–20 seconds.
Step 3 — Hazard Assessment (the RAG Engine)
GeoScreen’s rule-based RAG (Red–Amber–Green) engine then processes the retrieved data.
Eleven geohazards and planning constraints are assessed:
Mining Legacy, Compressible Ground, Shrink–Swell Clays, Slope Instability, Dissolution Features, Made Ground, River and Coastal Flood Risk, Surface Water Flood Risk, Radon, Ground Gas, and Source Protection Zone.
Each module outputs:
- A hazard rating (Low, Medium, High, or Very High)
- A corresponding data confidence level
These results are aggregated into an overall site risk rating using defined logic. For example:
- A single Very High hazard drives an overall Very High rating
- Multiple Medium hazards may combine to produce a High overall rating
The key point is consistency: every site in England is assessed using exactly the same rules.
Step 4 — Figure Generation
While hazard assessment runs, GeoScreen generates thirteen annotated map figures in parallel.
These include:
- Site location plan
- BGS bedrock and superficial geology
- Environment Agency river and coastal flood mapping
- Surface water flood risk (NAFRA2)
- Heritage and ecology constraints
- Mining Remediation Authority data
- Radon potential
- Groundwater source protection zones
- Historical OS mapping (c.1885, c.1888–1913, c.1919) from the National Library of Scotland
Each figure includes a north arrow, scale bar, and title bar. Historical maps are also analysed using AI to highlight features of potential geotechnical or environmental relevance.
Step 5 — AI Narrative Generation
Sixteen report sections are generated concurrently using the Anthropic Claude API.
These cover:
- Site setting and planning context
- Heritage and ecology
- Geology and hydrogeology
- Individual geohazard assessments
- Foundation considerations
- Conclusions and recommendations
- Executive summary
Each section is generated using a structured prompt that injects site-specific data and applies over fifty language and logic rules.
The AI generates the wording. The rules — defined by a Chartered Geotechnical Engineer — determine the outcome.
Step 6 — Assembly, QA, and Delivery
All components — narrative, figures, tables, and structured data — are assembled into a professional DOCX report.
The report is then passed through automated QA checks and issued to the client by email.
Total elapsed time: typically 70–90 seconds from submission to delivery.
What GeoScreen Is — and What It Is Not
A GeoScreen Tier 1 report is a controlled, rule-based geotechnical decision-support product.
Every output — hazard ratings, geological descriptions, planning constraints, and recommendation statements — is derived from explicit, documented logic applied consistently to publicly available data.
It is not a substitute for a Chartered Geotechnical Engineer’s professional judgement on a complex site.
But for early-stage feasibility, multi-site screening, and pre-acquisition decision-making, it provides a level of speed, consistency, and accessibility not achievable through traditional workflows.
Explore GeoScreen
Sample Tier 1 reports for sites across England — including High-risk and Low-risk examples — are available to download at geoscreen.uk.
A Tier 1 Preliminary Ground Risk Screening Report is available from £150 + VAT (£180 inc. VAT), with results delivered by email in around 90 seconds.
A Tier 0 Ground Risk Snapshot — RAG ratings and all figures without the full narrative — is also available from £75 + VAT.
Tristan Morgan BSc (Hons) EurGeol CGeol FGS AMICE is a UK Registered Ground Engineering Specialist and Director of Magnum GSI Ltd. GeoScreen™ is an automated ground risk screening platform available at geoscreen.uk.