


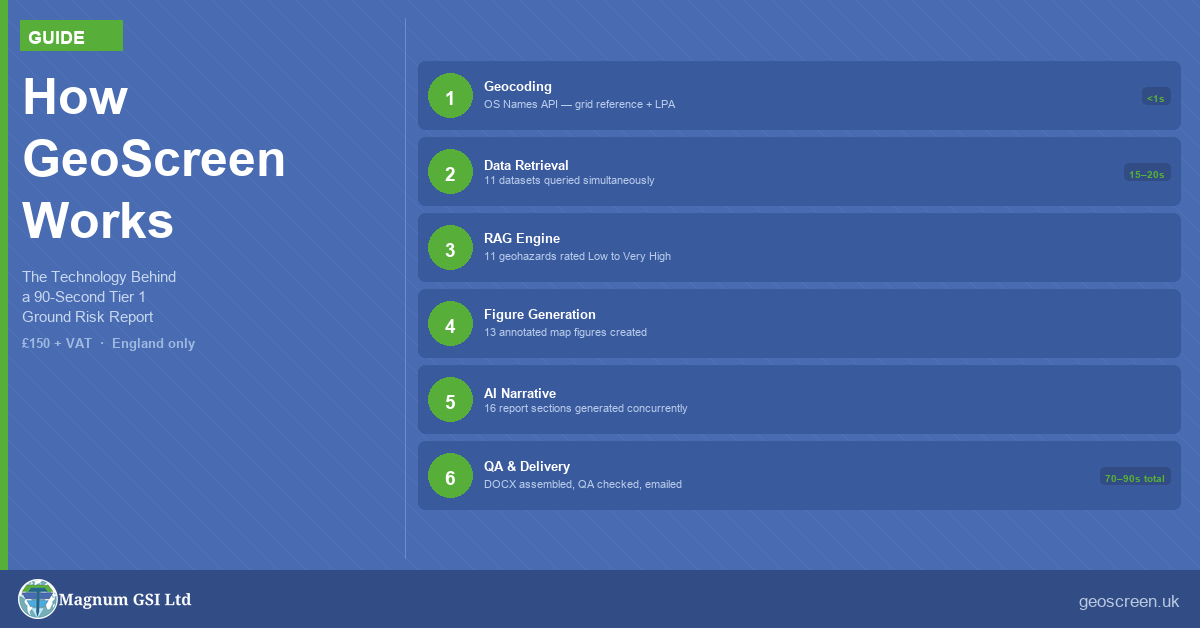
How GeoScreen Works — The Technology Behind a 90-Second Ground Risk Report
When people hear that GeoScreen delivers a Tier 1 Preliminary Ground Risk Screening Report — a fully automated desk-based assessment — in around 90 seconds, the first question is simple:
How?
A manually produced desk study typically takes a competent geotechnical engineer one to two days. What GeoScreen does differently is not simpler — it is faster, parallel, and structured.
Here’s what’s actually happening under the hood — and, since several of you asked, exactly which datasets get interrogated along the way.
Step 1 — Geocoding
When a site reference is submitted — postcode, address, or grid reference — GeoScreen queries the Ordnance Survey Names API to resolve it to a precise OS National Grid Reference (easting and northing). Before paying, the customer sees that point on a map and confirms the pin is on the right site, dragging it if it isn’t.
This coordinate becomes the anchor for every subsequent data query. At the same time, the system identifies the relevant Local Planning Authority, and whether the site is in England or Wales — which decides which agencies’ data is used from here on.
This step typically completes in under one second.
Step 2 — Parallel Data Retrieval
GeoScreen then interrogates more than twenty publicly available datasets simultaneously — all in parallel rather than sequentially. Most are queried live from the source agency at the moment the report is ordered; a handful of large national registers are held as local extracts and refreshed on a regular cycle, because querying them live would be slower and less reliable. Each answers a specific question about the ground, the setting, or the constraints on a site.
Geology and ground conditions
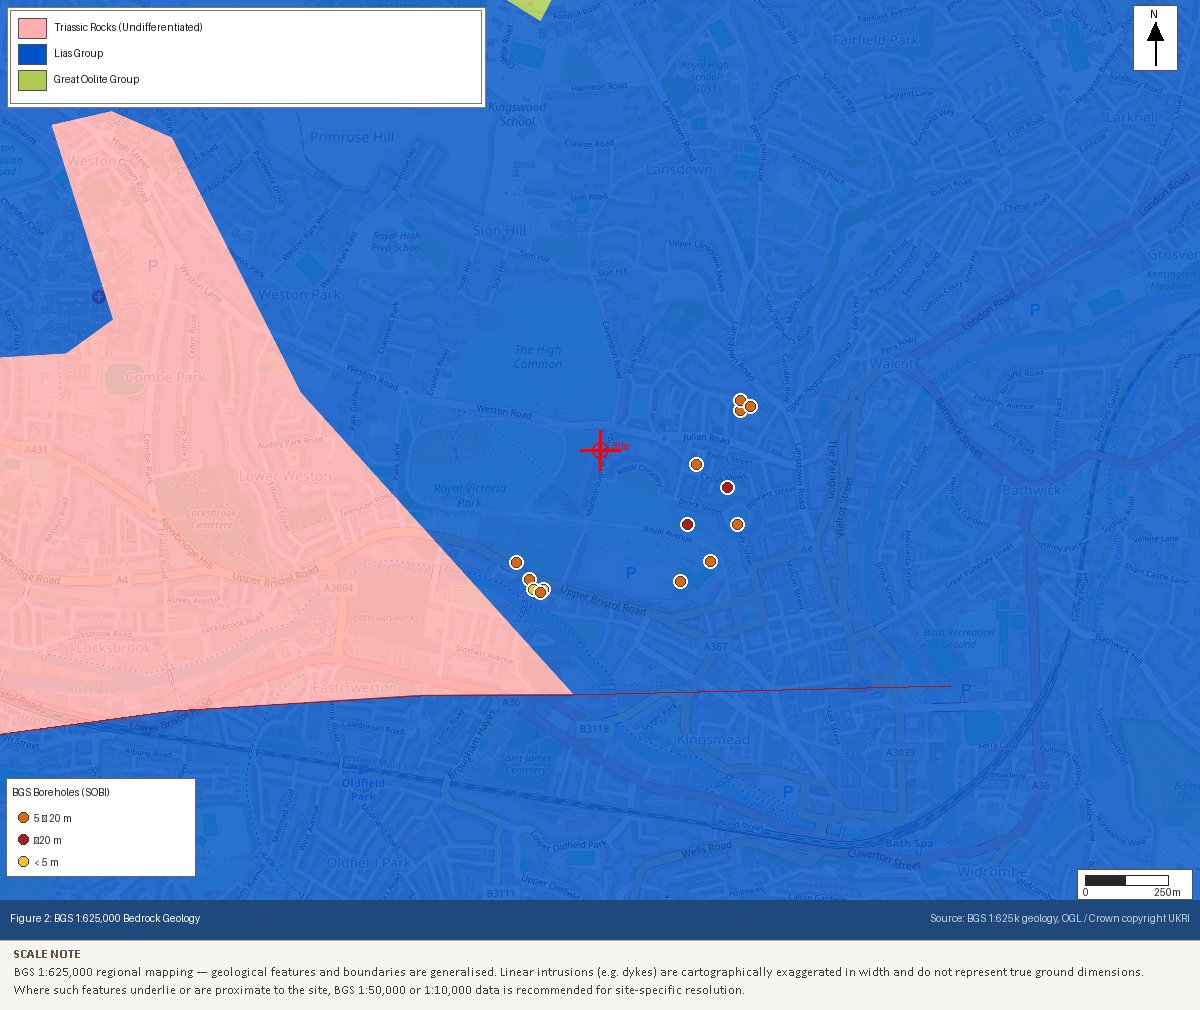
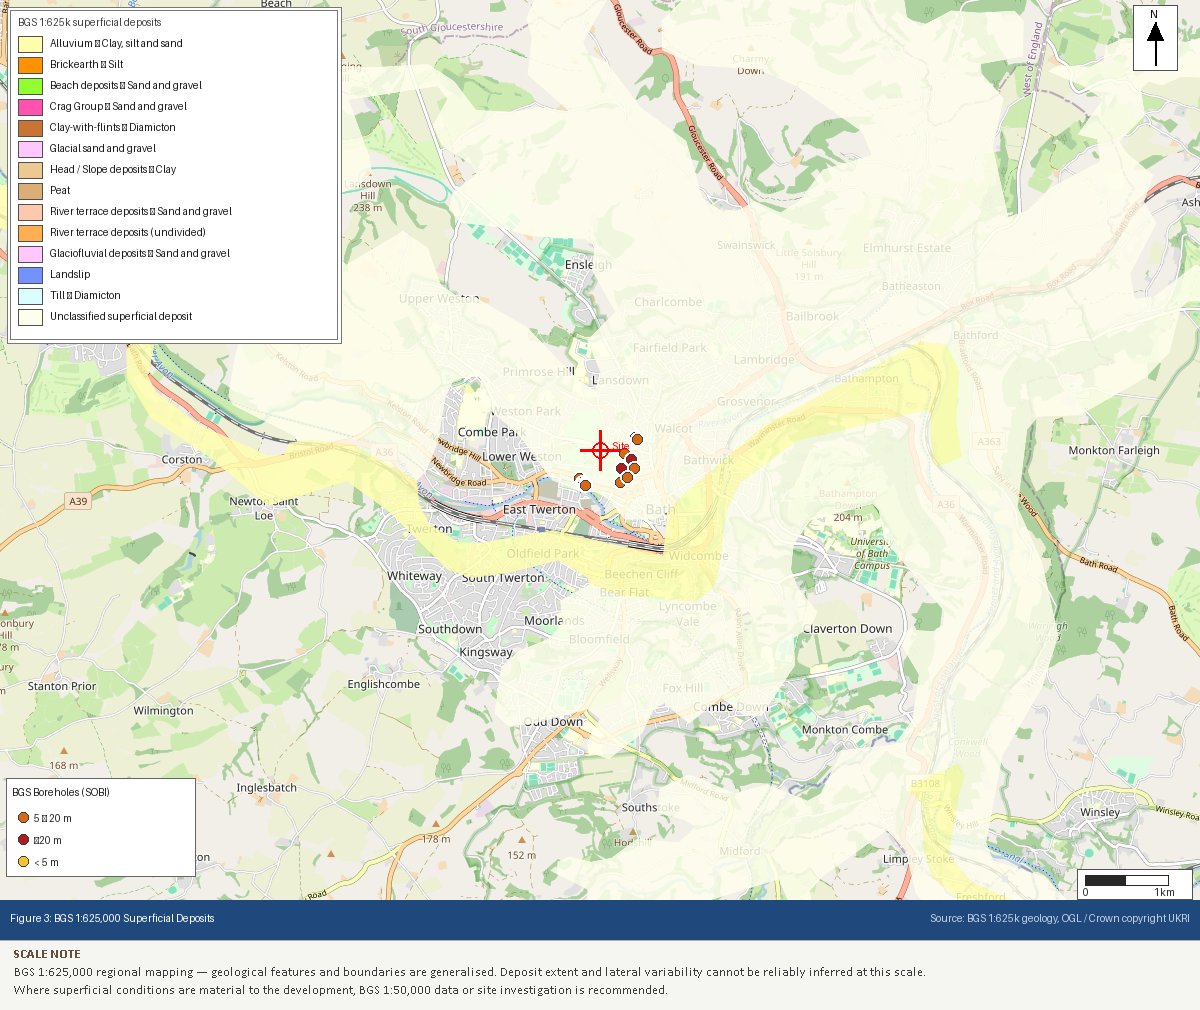
- BGS 1:625,000 bedrock and superficial geology — the rock and near-surface deposit types that drive most geotechnical behaviour, from compressible alluvium to shrink–swell clays to soluble strata
- BGS Single Onshore Borehole Index (SOBI) — historical ground investigation records within 500m
- BGS geological fault data — mapped faults within the study area
- BGS GeoIndex hydrogeology — the aquifer designation (Principal, Secondary A/B, or Unproductive)
- BGS 1km non-coal mining hazard grid — vein minerals, chalk, evaporites and building-stone mining potential
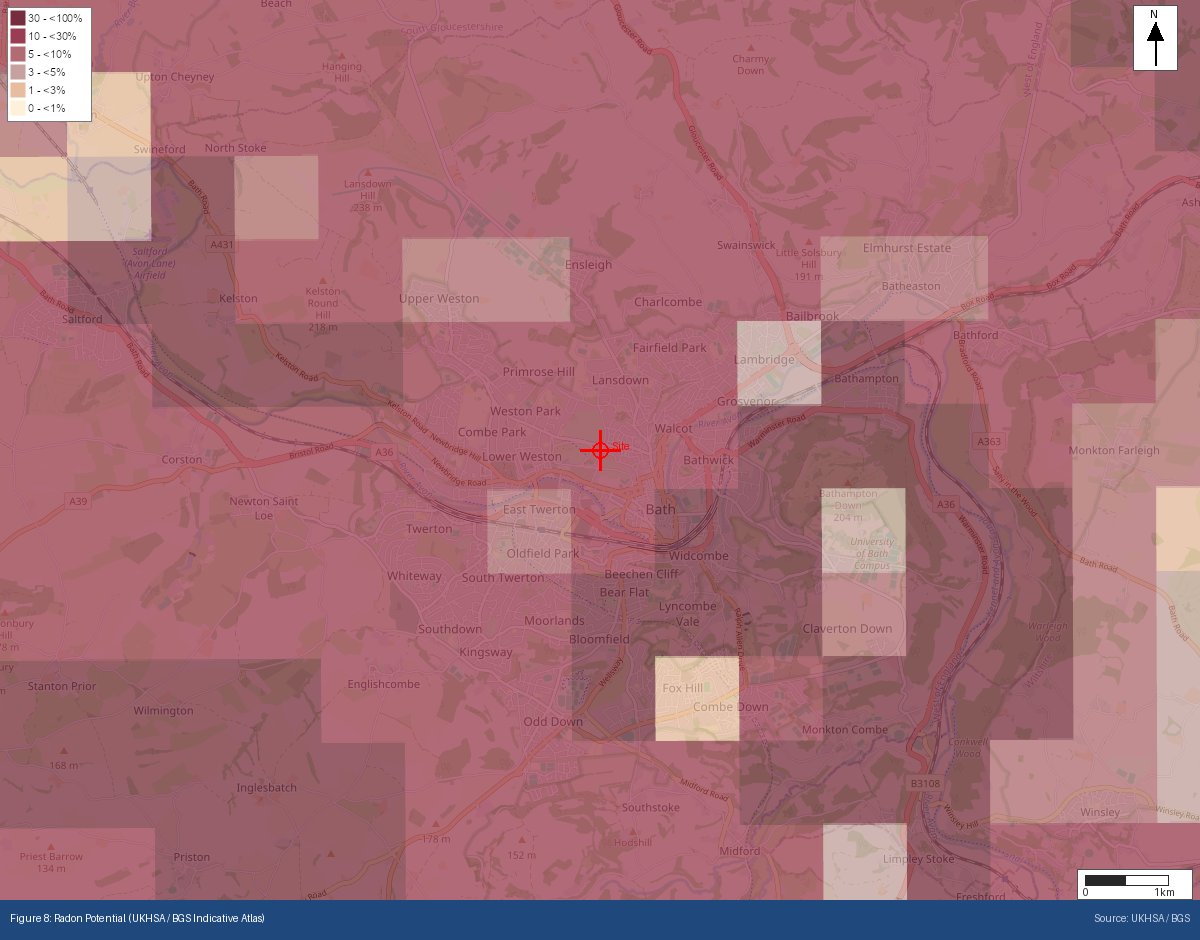
- BGS / UKHSA radon potential — the radon class, which determines whether protective measures may be required under BR 211
Mining
- Mining Remediation Authority (MRA) data — Development High Risk Area designation and recorded mine entries, each classified individually as a shaft or an adit, with those within 500m listed in their own table
Flooding and water
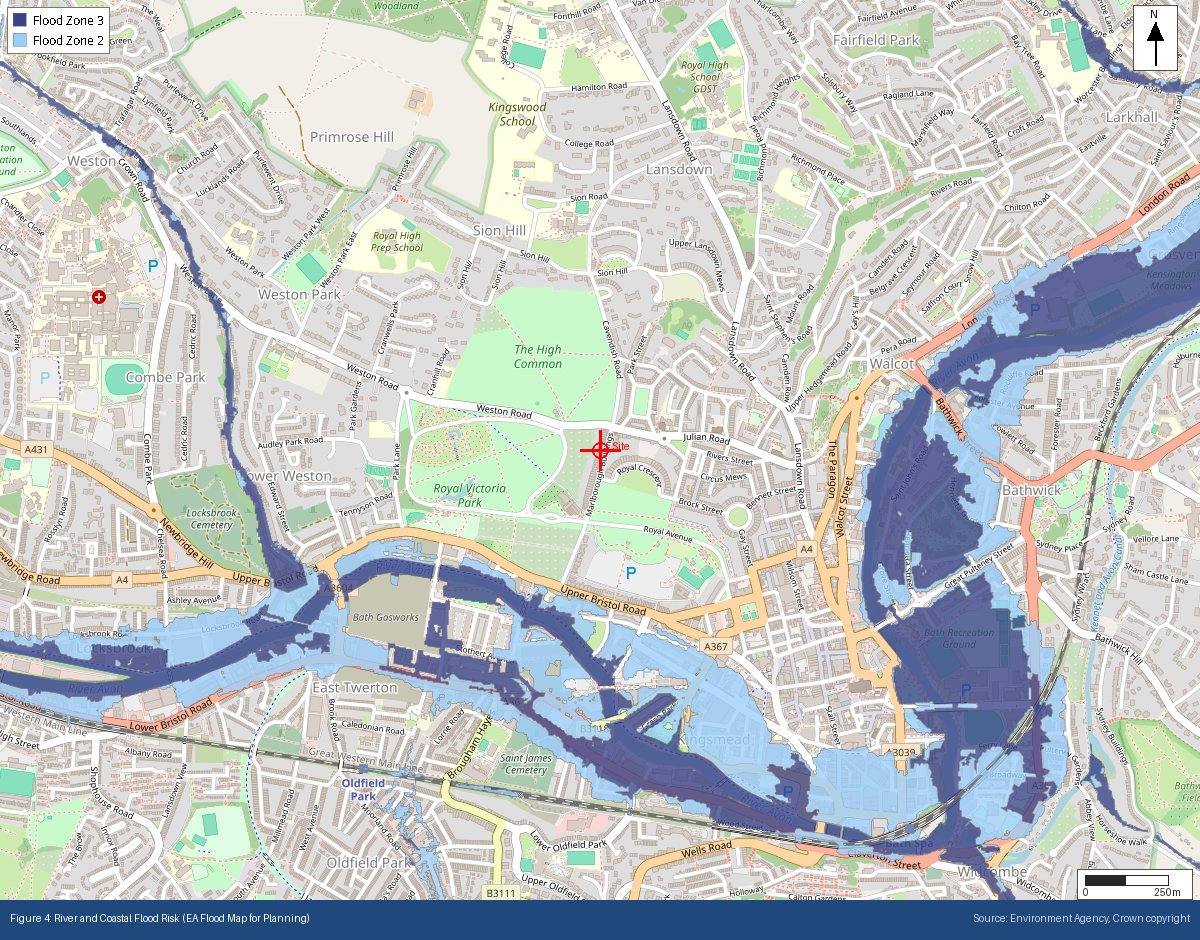
- EA Flood Map for Planning — river and sea flood zone (FZ1/2/3)
- EA surface water flood mapping (NAFRA2) — pluvial flood risk, assessed separately from river flooding
- EA defended flood risk mapping — shown for reference alongside the statutory flood zones, which deliberately ignore flood defences
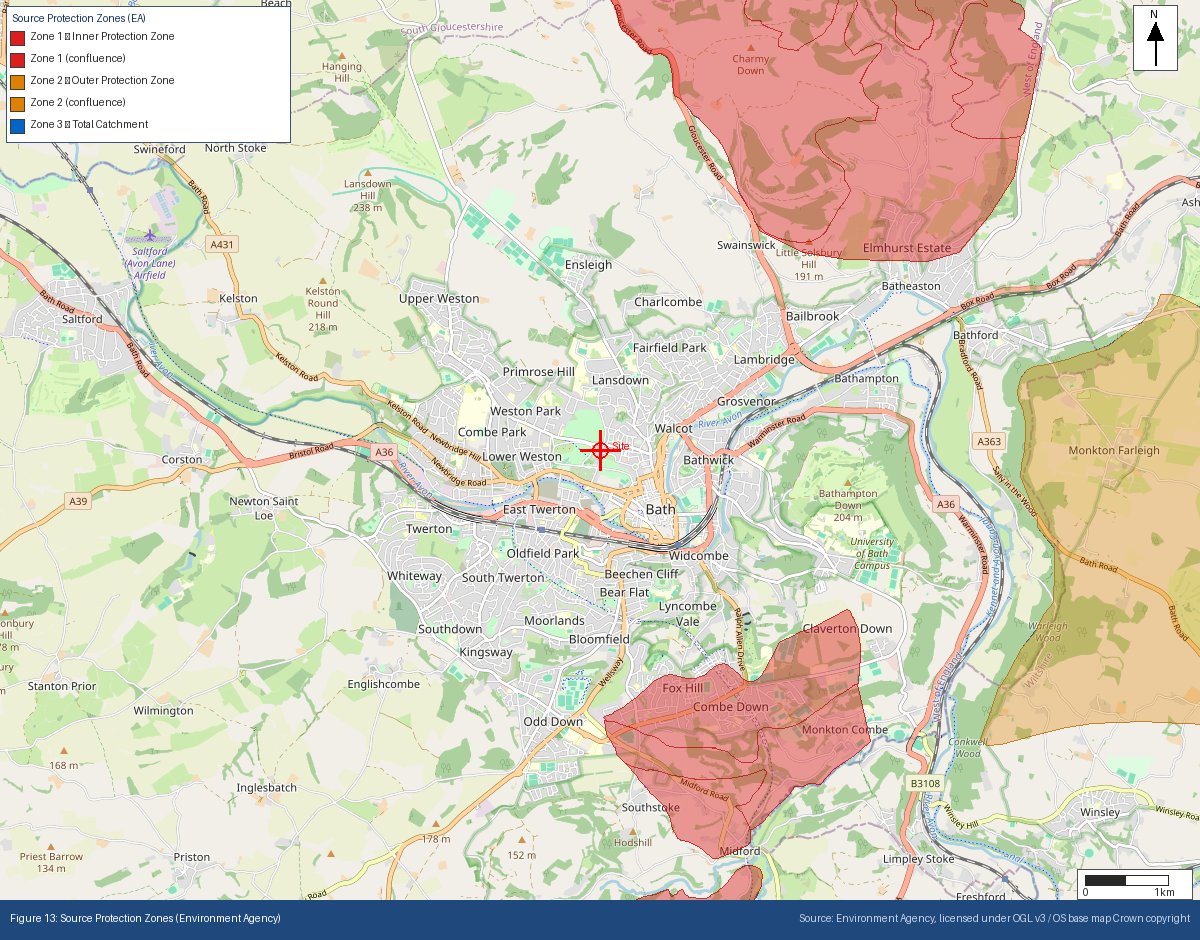
- EA Source Protection Zones — proximity to groundwater abstraction protection zones
- EA WFD water bodies — rivers, canals, and tidal/estuarine reaches, to identify the named receiving watercourse
Land use and contamination
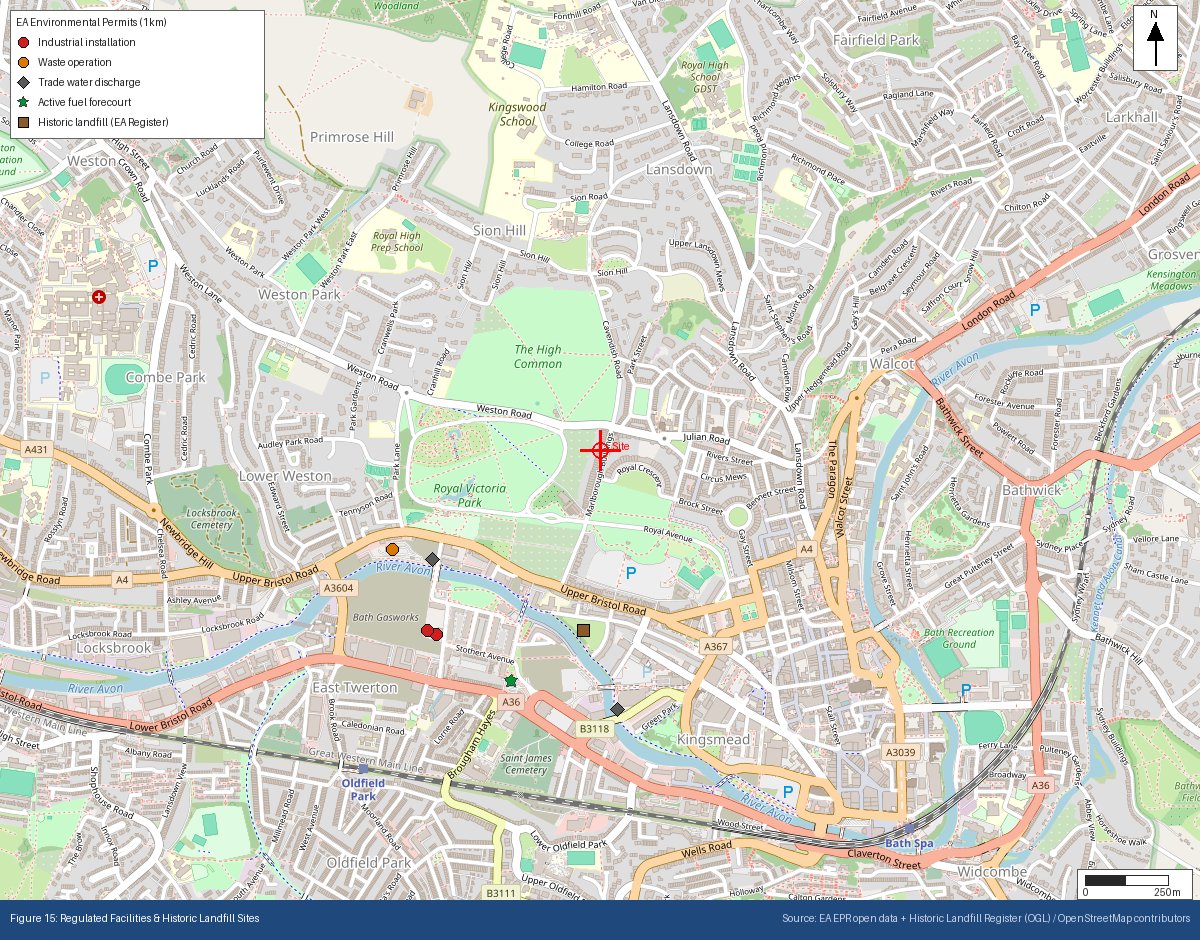
- EA Historic Landfill Register — a national register of over 19,000 closed landfill sites, many with no surface expression; any within 500m feed the ground gas assessment and Conceptual Site Model
- EA Permitted Waste Sites — currently authorised landfill and waste facility boundaries
- EA Environmental Permitting Register — regulated facilities within 1km: industrial installations, waste operations, radioactive substances, scrap metal and vehicle dismantling sites, trade discharges, sewage treatment works and flood defence assets — including minewater discharge consents cross-checked against MRA mapping
- OpenStreetMap (locally held extract) — petrol filling stations within 1km, active and closed. Exempt from environmental permitting and absent from every EA register, yet a recognised potential hydrocarbon source (underground storage tanks)
- OpenStreetMap (locally held extract) — sensitive infrastructure and land uses: gas holders, sewage and water treatment works, sub-stations and power stations, emergency services, hospitals, military, aviation, port, quarry and chemical works sites — including former and disused sites, which often matter more than active ones
Terrain
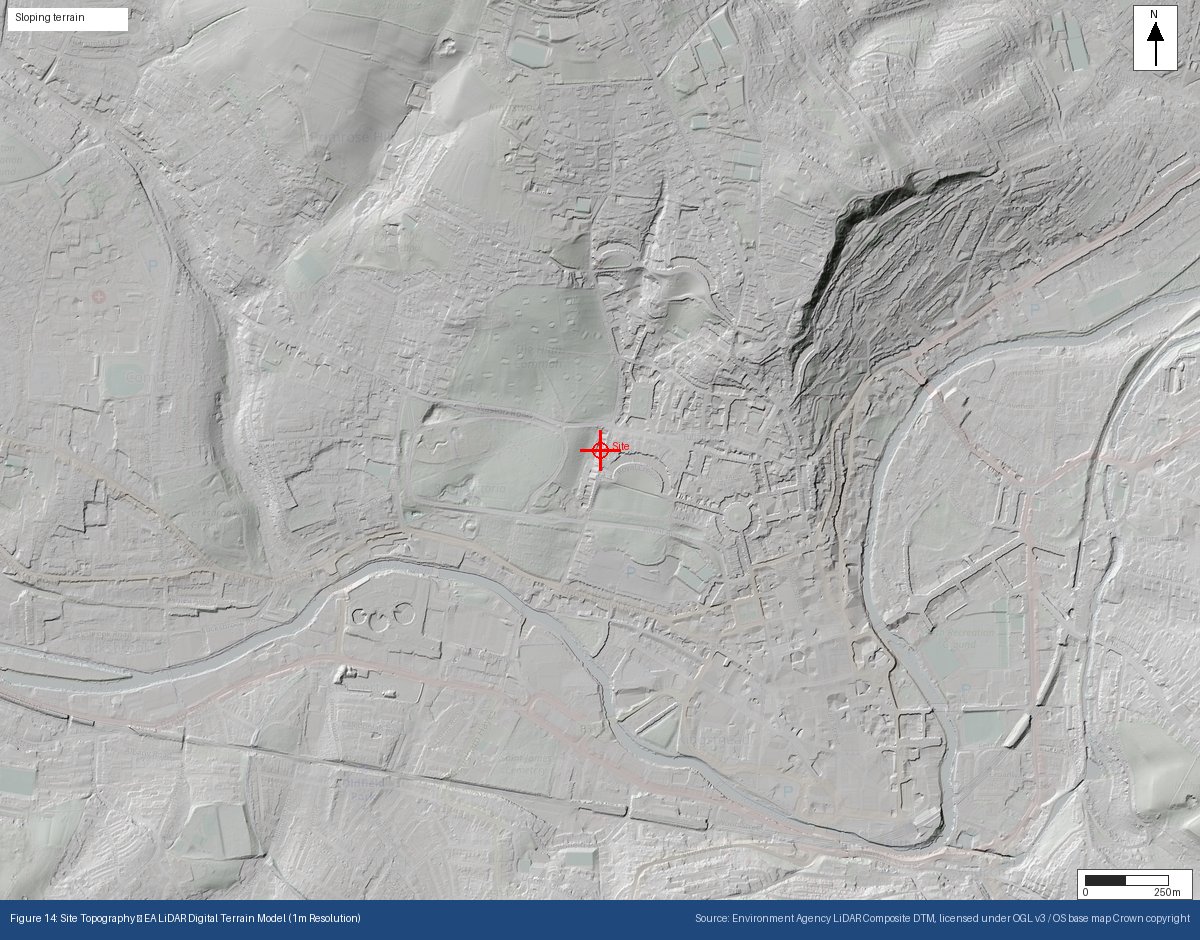
- EA National LiDAR 1m Digital Terrain Model — a hillshaded terrain model revealing how the site sits in the landscape, and subtle anomalies (made ground, former quarrying, infill) not visible on a standard basemap
Heritage and ecology
- Historic England NHLE — listed buildings, scheduled monuments and conservation areas within 500m
- Natural England datasets — SSSI, SAC, SPA, Ramsar, AONB and National Park designations within 2km
Historical mapping and buried structures
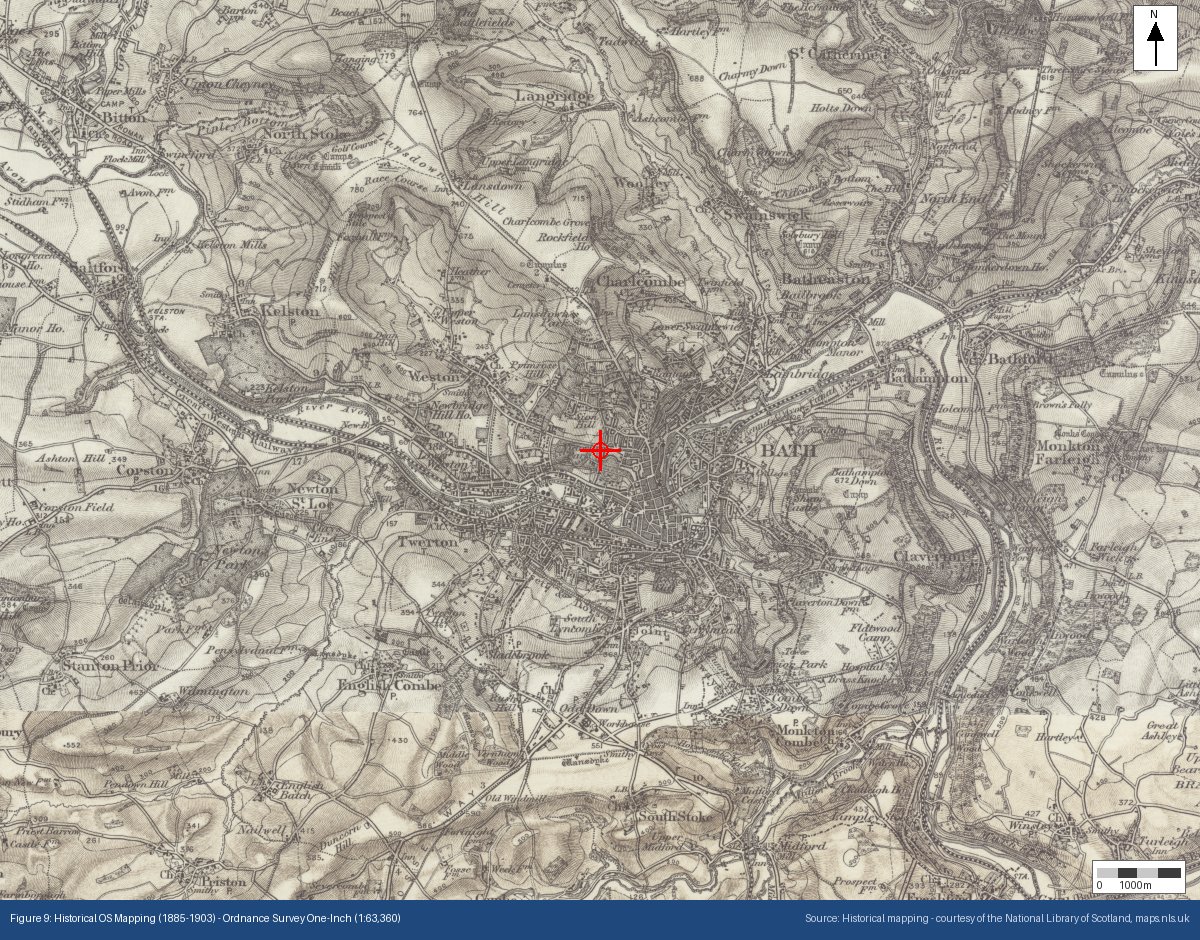
- National Library of Scotland historical OS maps — three epochs (c.1885 [1885–1903], 1888–1913 and 1919–1947), analysed by AI to identify former industrial use, pits, ponds and made ground of geotechnical or environmental significance
- GB1900 historical gazetteer — over a million transcribed labels from the same Victorian and Edwardian OS survey, used to position named historical features from their surveyed coordinates rather than from the AI’s own estimate, and to catch collieries, gasworks and works the AI misses
- Tunnels and underground structures — road, rail, pedestrian and waterway tunnels, subways and underpasses from OpenStreetMap, alongside historical tunnel labels from GB1900
Sites in Wales
For a Welsh site, the same checks run against the Welsh equivalents rather than the English datasets: Natural Resources Wales for flood zones, surface water flooding, Source Protection Zones, landfill, permits, water bodies, LiDAR and ecological designations; Cadw for heritage; and Planning Policy Wales rather than the NPPF for planning context.
Because everything runs concurrently, the data-gathering phase takes only as long as the slowest source to respond — not the sum of all of them.
Step 3 — Hazard Assessment (the RAG Engine)
GeoScreen’s rule-based RAG (Red–Amber–Green) engine then processes the retrieved data.
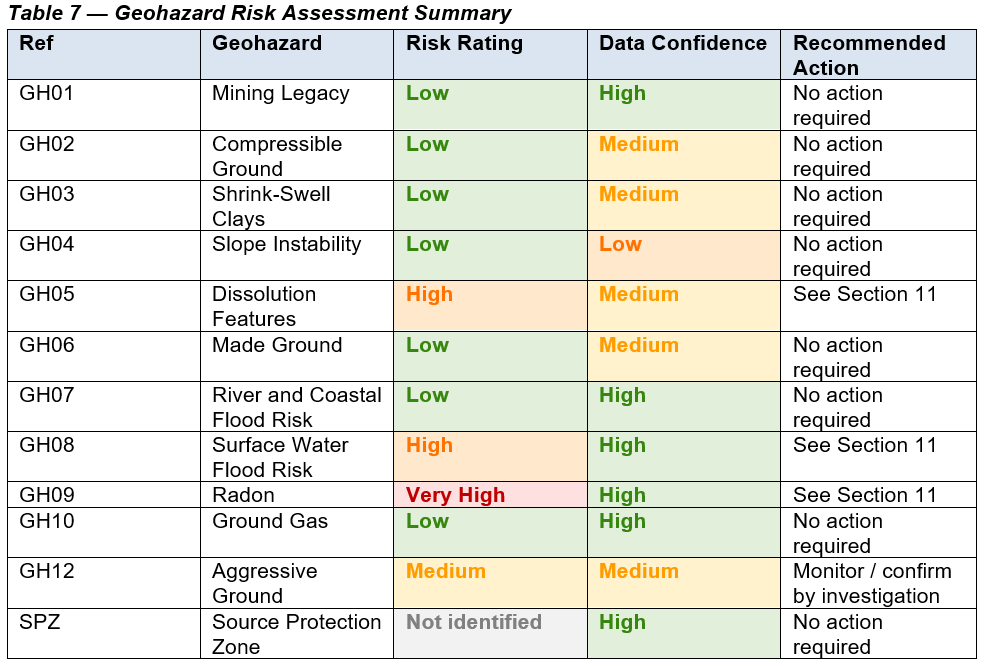
Eleven geohazards are assessed:
Mining Legacy, Compressible Ground, Shrink–Swell Clays, Slope Instability, Dissolution Features, Made Ground, River and Coastal Flood Risk, Surface Water Flood Risk, Radon, Ground Gas, and Aggressive Ground Conditions. Proximity to a Source Protection Zone is also reported. (Unexploded Ordnance screening is planned for a future release and is not part of the current Tier 1 assessment.)
Each module outputs:
- A hazard rating (Low, Medium, High, or Very High)
- A corresponding data confidence level
- A recommended action
These results are aggregated into an overall site risk rating using defined logic. For example:
- A single Very High hazard drives an overall Very High rating
- Multiple Medium hazards may combine to produce a High overall rating
The key point is consistency: every site in England and Wales is assessed using exactly the same rules.
Step 4 — Figure Generation
While hazard assessment runs, GeoScreen generates eighteen annotated map figures (Appendices A–R) in parallel.
These include:
- Site location plan
- BGS bedrock and superficial geology
- River and coastal flood mapping
- Surface water flood risk
- Heritage and ecology constraints
- Mining Remediation Authority data
- Radon potential
- Groundwater source protection zones
- LiDAR terrain model
- Permitted regulated facilities, historic landfill and fuel stations
- Historical OS mapping (c.1885, c.1888–1913, c.1919–1947) from the National Library of Scotland
- Historical and current map features, numbered to match the report’s features table
- Underground and buried structures
- Defended flood risk, for reference alongside the statutory flood zones
Each figure includes a north arrow, scale bar, and title bar. Historical maps are also analysed using AI to highlight features of potential geotechnical or environmental relevance.
Step 5 — AI Narrative Generation
Sixteen report sections are generated concurrently using the Anthropic Claude API.
These cover:
- Site setting and planning context
- Heritage and ecology
- Geology and hydrogeology
- Individual geohazard assessments
- Foundation considerations
- Conclusions and recommendations
- Executive summary
Each section is generated using a structured prompt that injects site-specific data and applies over fifty language and logic rules.
The AI generates the wording. The rules — defined by a Chartered Geotechnical Engineer — determine the outcome.
Step 6 — Assembly, QA, and Delivery
All components — narrative, figures, tables, and structured data — are assembled into a professional DOCX report.
The report is then passed through automated QA checks. A report that fails them is held back for review rather than sent; one that passes is issued to the client by email.
Total elapsed time: typically around 60–90 seconds from submission to delivery for an English site, and a little longer for a Welsh one.
What GeoScreen Is — and What It Is Not
A GeoScreen Tier 1 report is a controlled, rule-based geotechnical decision-support product.
Every output — hazard ratings, geological descriptions, planning constraints, and recommendation statements — is derived from explicit, documented logic applied consistently to publicly available data.
It is not a substitute for a Chartered Geotechnical Engineer’s professional judgement on a complex site, and every report recommends a professional desk study where one is required.
But for early-stage feasibility, multi-site screening, and pre-acquisition decision-making, it provides a level of speed, consistency, and accessibility not achievable through traditional workflows.
Explore GeoScreen
Sample reports for sites across England and Wales — covering mining, dissolution, flood, radon and shrink-swell risk, in both Tier 0 and Tier 1 form — are available to download at geoscreen.uk.
A Tier 1 Preliminary Ground Risk Screening Report is available from £150 + VAT (£180 inc. VAT), with results delivered by email in around 90 seconds.
A Tier 0 Ground Risk Snapshot — RAG ratings and all figures without the full narrative — is also available from £75 + VAT.
Tristan Morgan BSc (Hons) EurGeol CGeol FGS AMICE is a UK Registered Ground Engineering Specialist and Director of Magnum GSI Ltd. GeoScreen® is an automated ground risk screening platform available at geoscreen.uk.
